


Commission assaults rural development spending to protect direct payments
Written by Alan Matthews
The Commission’s MFF proposal (including both ceilings for expenditure as well as ideas on how to finance the budget) was published yesterday. The Commission claims that the proposal includes reductions of roughly 5% in both the Common Agricultural Policy and Cohesion Policy programmes, as they have the largest financial envelopes. However, another way of looking at the numbers suggests that the cut is more like 15% overall in real terms over the period of the next MFF, but with a much bigger cut in Pillar 2 rural development expenditure of around 26%. Direct payments will be maintained constant in nominal terms. In this post, I set out the analysis behind these figures.
Budget Commissioner Oettinger had been indicating for some time before the publication of the MFF proposals that the CAP budget would be cut by around 6%. But without specifying the units or the time period in greater detail, this is almost a meaningless figure. Is the 6% cut in real or nominal terms? Does it represent the difference between the CAP budget in 2027 and its budget in 2020, or the difference between the resources made available for the whole MFF period 2021-27 compared to the MFF period 2014-2020? Now that the figures are published some of these questions can be answered.
Key assumptions behind the analysis
There are various definitional issues to be considered in making a comparison between CAP spending in this programming period and the next one:
• Are we trying to compare the change in the total resources made available to the CAP for the two programming periods 2014-20 and 2021-2027, or are we measuring the change in the CAP budget by comparing the size of the budget in 2020 (the last year of the current programming period) with 2027 (the last year of the next programming period)? Because the annual amounts allocated to the CAP vary within each of the two programming periods (in real terms), these two comparisons will not necessarily give the same answer. For example, direct payments in the newer Member States that joined in 2007 and 2013 were phased in over a number of years, so the total budget required for 2021-2027 would need to be a little bit larger than in 2014-2020 to hold payments constant for farmers in the other Member States.
• Should we make the comparison in real (constant price) or nominal (current price) terms, and if in real terms, what deflator do we use? Most would agree that what matters to farmers is the ‘real’ value of support, that is, nominal amounts adjusted for inflation. The Commission uses an assumed 2% inflation rate per year to adjust current prices to constant prices and vice versa over the period of the next MFF (footnote 12 in the Communication). However, this assumed rate of inflation does not necessarily correspond to the actual rate of inflation. Using the Harmonised Index of Consumer Prices as the inflation measure, during the 2007-2013 MFF the average inflation rate in the EU-28 was 2.1%, but in the first four years of this MFF 2014-2017, it was only 0.6% (Eurostat domain prc_hicp_cmon]. To the extent that actual inflation is less than what the Commission assumes, there is a windfall gain in real terms to CAP recipients.
• We need to take account of Brexit in the comparision. The 2021-2027 MFF is only for 27 countries, the 2014-2020 MFF was for 28 Member States as Croatia joined on 1 July 2013.
• The MFF headings are established in terms of commitment appropriations. While for direct payments (the main element of Pillar 1 expenditure, in addition to market support expenditure), commitment and payment appropriations are the same, this is not necessarily the case for market support expenditure and Pillar 2 rural development expenditure. Pillar 2 commitment appropriations can vary from year to year as rural development programmes build up momentum or experience delays in implementation at the beginning of a programming period. While this is important when looking at the annual budgets, in the MFF tables the annual commitment appropriations tend to be spread evenly over the programming period. Also, the MFF ceilings for commitment appropriations are ceilings, and may not actually be used. For example, the ceilings for market support expenditure will not be required if EU markets for agricultural products are generally buoyant.
• Member States could shift resources in the current programming period from Pillar 1 to Pillar 2 or vice versa either through modulation (flexibility) or through the proceeds of capping/degressivity. The net effect of these changes was to reduce the Pillar 1 budget by about €3 billion and to increase the Pillar 2 budget by a similar amount. Although this does not change the overall CAP budget, it makes a difference when comparing the changes for the individual Pillars whether we use for the comparison the original allocations or the allocations after these changes were made.
• Finally, in determining to what extent the Commission proposal represents a discretionary cut in the CAP budget, the baseline that is being used is important. Comparing the CAP budget in 2021-2027 in real terms with the CAP budget in 2014-2020 in real terms (or the CAP budget in 2027 with the CAP budget in 2020 in real terms) assumes that the appropriate baseline for the CAP in the 2021-2027 period is that the CAP budget should be maintained in real terms. This can and should be questioned. Around 72% of the CAP budget is spent on direct payments. There was never a commitment to maintain the value of direct payments in real terms. They have always been established in nominal terms and we would expect their value to naturally fall in real terms in the absence of any discretionary change. If this assumption is built into the CAP baseline, then the discretionary cut in CAP spending will be smaller than if the assumption is made that the EU would otherwise have increased the value of direct payments in line with inflation.
What the figures show
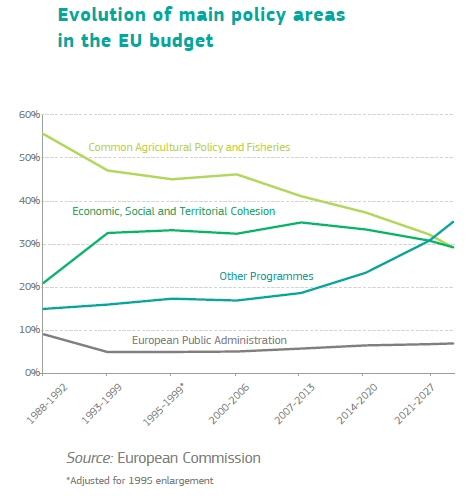
The Commission’s Communication has a nice graphic which shows the expected changes in the shares of the overall EU budget allocated to the CAP and cohesion funding, both of which would fall to 30% of the total by the end of the programming period if the Commission’s proposal is accepted.
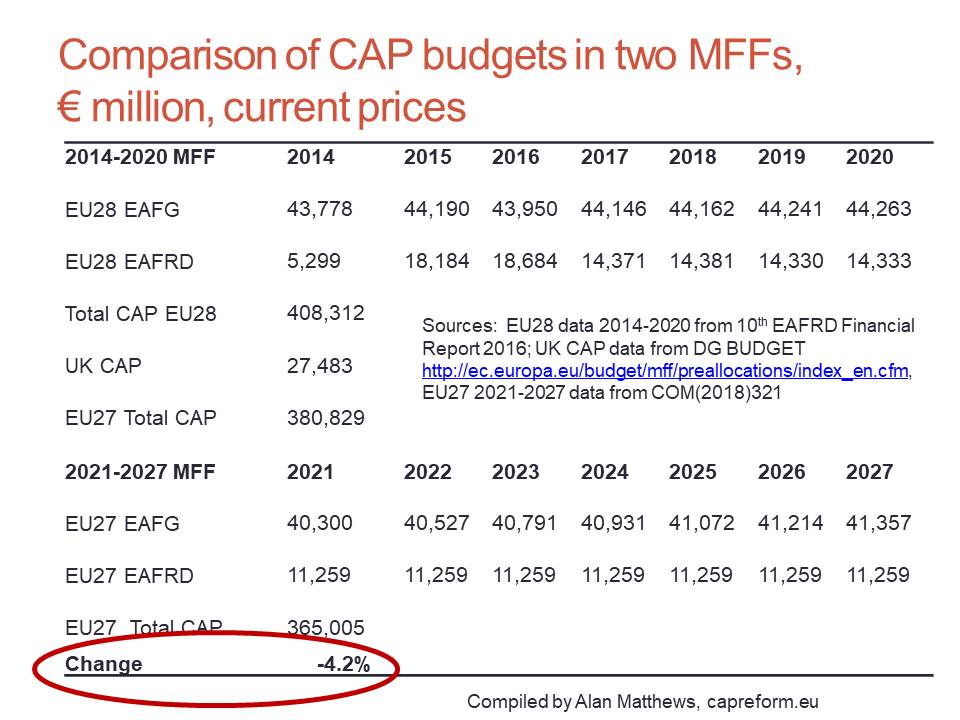
I first attempt to reproduce the Commission’s calculations in the following table. It is clear that the 5% cut can only be derived if the comparison is made in current prices (nominal amounts) and with respect to the total resources in the two MFF periods. Indeed, my rough calculations suggest that the cut in the CAP budget on this basis might even be lower at 4% than what the Commission estimates.
A more insightful way of making comparisons of the CAP budget between the two periods is to compare the end year 2020 with the end year 2027. Here the Commission has been less than transparent. In contrast to the presentation of its MFF proposal in 2011 for the 2014-2020 period, the tables provided with this proposal do not show expenditure on the various MFF headings in the last year (2020) of the current period. Thus, a little detective work is required to make these comparisons between the two years. The outcome of this work is shown in the following table.
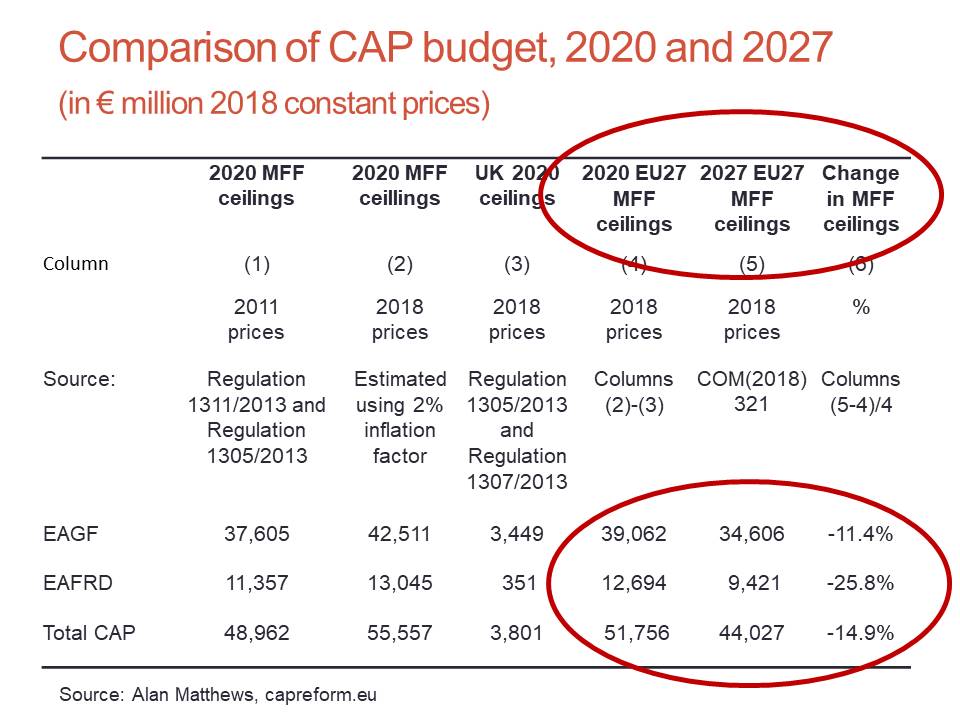
The Commission’s MFF proposal for 2021-27 is drawn up in 2018 prices. Column (1) in the table above is based on the Council Regulation laying down the MFF framework for the years 2014-2020 in 2011 prices. It only gives the ceiling for the EAGF (funding Pillar 1 direct payments and market price support). To get an estimate of the EAFRD amount, I used the figures in the 2013 Rural Development Regulation in current prices, and deflated these to 2011 prices using the 2% deflator. Note that these figures are before modulation between the Pillars. This is the appropriate basis for comparison as we do not know how Member States will use the proposed flexibility to modulate funds in the coming programming period.
In Column (2), these amounts in 2011 prices are converted to 2018 prices using the 2% deflator to make them comparable to the price basis used in the Commission’s proposal for the MFF for the period 2021-2017. However, the EAGF total in 2018 prices using this method (€43,196 million) is slightly higher than the EAGF total in 2018 prices given in the Commission’s technical revision of the MFF in 2018 prices in preparing the 2018 draft budget (€42,511 million). As the latter is the more up-to-date figure, I have substituted it for the EAGF amount in Column (2). The EAFRD amount is calculated from the Column (1) amount using the 2% deflator.
Next, we must deduct the commitment appropriations due to the UK in 2020 from these amounts in order to arrive at the EU27 totals. I have used as an estimate of these the amounts scheduled for the UK in the 2013 Direct Payments Regulation (for the EAGF) and the Rural Development Regulation (for the EAFRD). These amounts are given in current prices in these Regulations, so they are shown in 2018 prices using, again, the 2% deflator in Column (3). Subtracting the UK amounts in Column (3) from the EU28 amounts in Column 2) gives us the EU27 MFF ceilings in 2020 in 2018 prices shown in Column (4).
Finally, we can compare our estimate of the MFF ceilings in 2018 prices for the EU27 in 2020 with the proposed MFF ceilings for the EU27 in 2027, also in 2018 prices, given in yesterday’s Commission proposal. The 2027 figures are shown in Column (5) and the percentage changes in Column (6).
The results are striking. Pillar 1 expenditure in real terms will be more than 11% lower in 2027 compared to 2020, but Pillar 2 expenditure will be almost 26% lower. The Commission proposals mention that it is proposed to increase the co-financing rates required from Member States for Pillar 2, so that total spending on rural development may not decrease by the same extent as the EU budget resources. Nonetheless, it is a striking indication of the Commission’s priorities that the more severe cuts are made in the more targeted Pillar 2 payments while income support payments in Pillar 1 are largely protected.
The next table makes this point more clearly. As pointed out previously, there was never a commitment to maintain the value of direct payments in real terms. The appropriate baseline for comparison is therefore Pillar 1 expenditure in nominal terms (this is an approximation because Pillar 1 also includes some market support expenditure). The table compares CAP Pillar 1 spending in 2020 and 2027 in current prices, that is, in nominal terms.
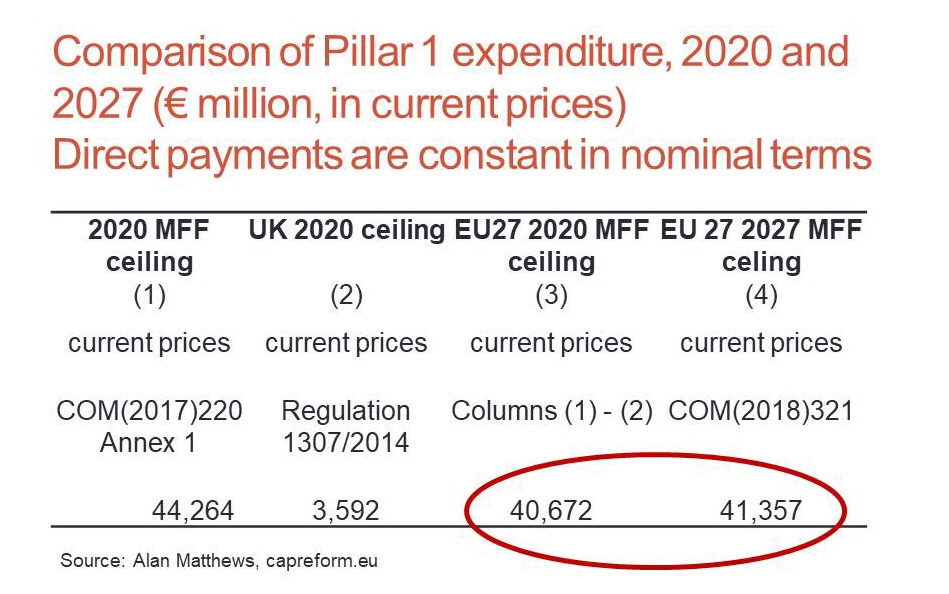
The table shows that Pillar 1 expenditure will be held constant in nominal terms. Thus, (bearing in mind that Pillar 1 also covers expenditure on market price support) there is no discretionary cut in direct payments (although of course farmers will notice that they fall in real terms, depending on the realised inflation rate during the period). This treatment can be contrasted with Pillar 2 expenditure where maintaining expenditure in real terms would be a more realistic baseline. Here, in spite of the Commission rhetoric about increasing the level of environmental and climate ambition in the CAP, there is a fairly massive discretionary cut of around one-quarter over the MFF period.
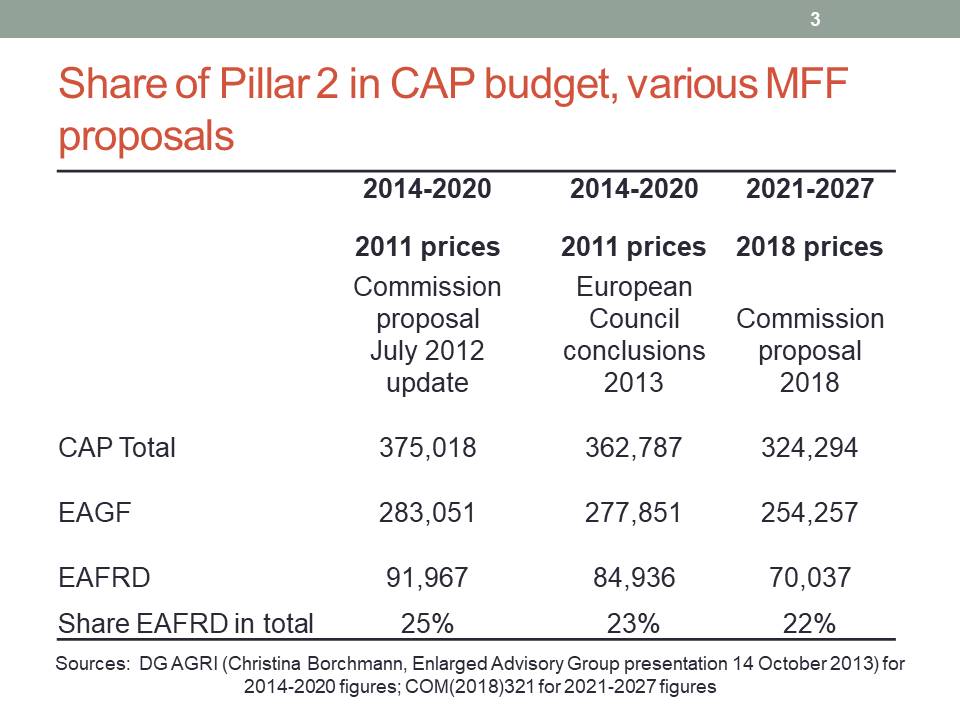
The conclusions of the previous analysis might be criticised because it required various assumptions which may be not quite accurate. So it is useful to look at a more direct comparison of the shares of Pillar 1 and Pillar 2 in the two MFF programmes. In the next table, the numbers cannot be compared directly because they are expressed in different prices, but the shares can. In this case, we are comparing shares in the total resources available in each programming period, and not just an ‘end-to-end’ comparison. But the conclusion is the same. Pillar 2 rural development expenditure is increasingly squeezed while Pillar 1 direct payments are relatively protected.
Conclusions
The claim of the Commission that the CAP budget in its MFF proposal will only be cut by 5% relative to the current MFF seems to be based on making the comparison in nominal terms and comparing the total resources in each programming period.
Spending trends are better captured by comparing proposed commitments in 2027 with proposed commitments in 2020. This comparison suggests that the overall CAP budget will fall by around 15% over the period of the next MFF. Direct payments will be maintained in nominal terms but rural development payments will fall by one-quarter. Farm Europe arrives at similar orders of magnitude in its calculations.
This slow squeeze on Pillar 2 while Pillar 1 direct payments are (relatively) proteccted does not square with the Commission’s rhetoric that the next CAP will require a higher level of enviromental and climate ambition.
The Commission may point to the higher level of co-financing that will be demanded from Member States. It may also highlight that there will be flexibility in the next programming period to allow Member States to modulate resources between the Pillars (though the proposals indicate that modulation can go in either direction). On the other hand, the UK had a relatively low share of Pillar 2 receipts in its total CAP receipts, so its exit should have raised the share of Pillar 2 in total CAP expenditure, other things equal.
It is also possible that higher environmental and climate ambition can be driven by stronger regulation, such as the new conditionality to be attached to the receipt of direct payments. But it is hard to see that the Commission intends to do much more than fold the existing cross-compliance and greening requirements into the new conditionality, without necessarily raising the level of ambition.
To the extent that the EU budget expresses the Commission’s priorities, as it takes every opportunity to reiterate, the message is clear. Direct payments to farmers must be relatively protected, even at the expense of severe cuts to Pillar 2 rural development expenditure.
This post was written by Alan Matthews
Photo credit: Stevepb on pixabay, CC0 Creative Commons licence.
Continue reading...