


- Location
- Stoneleigh
Yesterday we published the final AHDB Crop Development report of the 2020/21 growing season, which gives a pre-harvest update into the condition of the main crops in Great Britain. Making use of the regional and national condition scores enables a picture of how 2021/22 production could shape up.
Additionally, our annual planting and variety survey (PVS), released last week, gives us an updated look at planted area figures. Using both of these releases, we can make some robust estimations into yield and therefore production for the upcoming harvest.
In order to produce these estimates the following rules have been applied for estimating yield from crop condition ratings*;
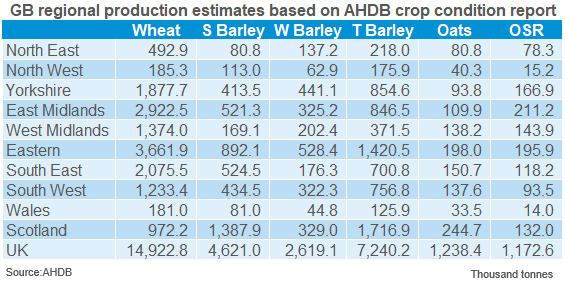
Starting with the domestic wheat crop, GB production could be pegged at 14.92Mt based on the GB condition score provided in our crop development report. This is 1% below the 2015-2019 average and 55% better than last season. Against published industry estimates, this sits within the range.
Condition scores differed across the UK, highlighting the effect of the dry April and wet May and June. Scores have trended typically towards the upper end of ratings, with the Midlands in particular recording a ‘good’ to ‘excellent’ score of 84% and 85% for East and West respectively. Using this, a production figure of 4.29Mt is forecast for the Midlands region, 5% above the 2015 – 2019 average if realised.
As we know, the North of England is facing increased demand prospects in 2021/22 with Ensus and Vivergo bioethanol plants restarting production. Production for the North East, North West and Yorkshire is forecast at 2.55Mt. Though the planted area at 301.5KHa is 21% higher than last season, it is 10.5% below the 2015 – 2019 average. Combined with more average crop ratings for Yorkshire, this results in a production figure 8% below the 2015 – 2019 average. Delivered premiums could grow further to incentivise the haulage of wheat into this region as Anthony discussed yesterday.
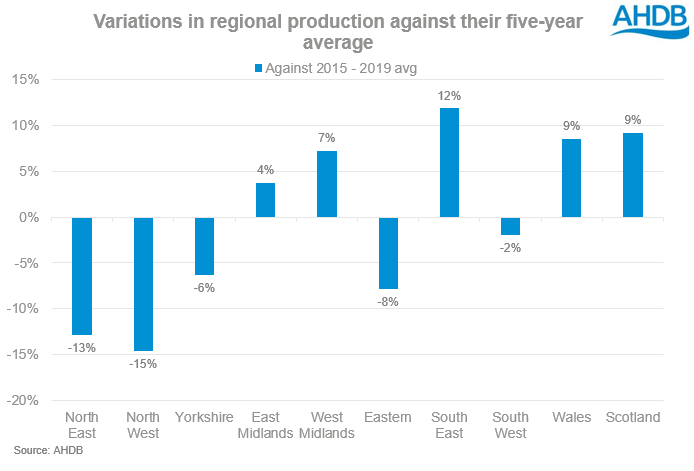
To avoid a potential reliance on imports for Northern homes, other regions will need to pick up the baton. The Midlands, as discussed above, is one avenue for this, though what about the Eastern region of England? Well, the ‘poor’ to ‘very poor’ ratings are seen highest in Southern and Eastern England condition scores, where typically light soils may have suffered worse from the prolonged dry spell in April. For the Eastern region, production can be estimated at 3.66Mt, 8% below the 2015 – 2019 average.
If we look at the condition scores, an estimated 1% of the GB winter wheat area is in very poor condition. In production terms, this is around 17.42Kha or 135.14Kt at risk of near crop failure or severe yield loss according to condition definitions. The production figure is calculated using a yield of 7.76t/ha (2018/19 yield) as per above methodology.
If we put these yield figures into an average gross margin calculator that I discussed last month, then a breakeven tonnage can be calculated. With Nov-21 futures closing at £169.90/t yesterday, the theoretical average yield of 8.56t/ha in this scenario creates a breakeven tonnage of 7.46t/ha without subsidies and storage values incorporated.
A tight supply end to the season has kept old-crop values high as the new-crop harvest looks to kick off a little later this year. Our delivered cereal prices as at 08 July highlights this, with E Anglia feed wheat quoted at £198.00/t for July delivery, Harvest delivery is quoted at £163.00/t, a discount of £35.00/t. Despite the return to a more average production figure, it remains likely the UK will require imports to satisfy an increased consumption demand.
GB regional wheat production estimates 2021/22
Join the 3.6K people who subscribe to our Grain Market Daily publication here
Additionally, our annual planting and variety survey (PVS), released last week, gives us an updated look at planted area figures. Using both of these releases, we can make some robust estimations into yield and therefore production for the upcoming harvest.
In order to produce these estimates the following rules have been applied for estimating yield from crop condition ratings*;
- Excellent –Maximum yield between 2015 – 2019.
- Good – 2015 - 2019 average yield plus 2.5%.
- Fair – 2015 - 2019 average yields.
- Poor – 2015 – 2019 average yields less 2.5%.
- Very poor – Minimum yield between 2015 – 2019.
Starting with the domestic wheat crop, GB production could be pegged at 14.92Mt based on the GB condition score provided in our crop development report. This is 1% below the 2015-2019 average and 55% better than last season. Against published industry estimates, this sits within the range.
Condition scores differed across the UK, highlighting the effect of the dry April and wet May and June. Scores have trended typically towards the upper end of ratings, with the Midlands in particular recording a ‘good’ to ‘excellent’ score of 84% and 85% for East and West respectively. Using this, a production figure of 4.29Mt is forecast for the Midlands region, 5% above the 2015 – 2019 average if realised.
As we know, the North of England is facing increased demand prospects in 2021/22 with Ensus and Vivergo bioethanol plants restarting production. Production for the North East, North West and Yorkshire is forecast at 2.55Mt. Though the planted area at 301.5KHa is 21% higher than last season, it is 10.5% below the 2015 – 2019 average. Combined with more average crop ratings for Yorkshire, this results in a production figure 8% below the 2015 – 2019 average. Delivered premiums could grow further to incentivise the haulage of wheat into this region as Anthony discussed yesterday.
To avoid a potential reliance on imports for Northern homes, other regions will need to pick up the baton. The Midlands, as discussed above, is one avenue for this, though what about the Eastern region of England? Well, the ‘poor’ to ‘very poor’ ratings are seen highest in Southern and Eastern England condition scores, where typically light soils may have suffered worse from the prolonged dry spell in April. For the Eastern region, production can be estimated at 3.66Mt, 8% below the 2015 – 2019 average.
If we look at the condition scores, an estimated 1% of the GB winter wheat area is in very poor condition. In production terms, this is around 17.42Kha or 135.14Kt at risk of near crop failure or severe yield loss according to condition definitions. The production figure is calculated using a yield of 7.76t/ha (2018/19 yield) as per above methodology.
If we put these yield figures into an average gross margin calculator that I discussed last month, then a breakeven tonnage can be calculated. With Nov-21 futures closing at £169.90/t yesterday, the theoretical average yield of 8.56t/ha in this scenario creates a breakeven tonnage of 7.46t/ha without subsidies and storage values incorporated.
A tight supply end to the season has kept old-crop values high as the new-crop harvest looks to kick off a little later this year. Our delivered cereal prices as at 08 July highlights this, with E Anglia feed wheat quoted at £198.00/t for July delivery, Harvest delivery is quoted at £163.00/t, a discount of £35.00/t. Despite the return to a more average production figure, it remains likely the UK will require imports to satisfy an increased consumption demand.
GB regional wheat production estimates 2021/22
Join the 3.6K people who subscribe to our Grain Market Daily publication here