The great global warming scam, worth a listen I think.

Dave645

Member
Arable Farmer
Location
N Lincs
Humans thrive during climate optimums - its the subsequent cooling that causes the fall of empires.

Analysis of tree ring data and ice cores suggest that the Minoan warm period (3000 years ago) was as warm as the Holocene climatic optimum (6000-8000 years ago).The Roman warm period(2000 years ago) was not quite so warm and the Medieval warm period (1000 years ago) cooler again.

View attachment 974949

So where does our current warm period fit in - there were no thermometers so we have to use historic records and archaeology. If the Vikings were growing barley on greenland during the medeival warm period, could you do that today ? Sea levels were 1.5-2.0 meters higher than now, during the medieval warm period - there are castles built on the coast that are now some way inland, and archaeologic evidence of jettys that high tide no longer reaches.so we must assume that we are not yet as warm as the MWP.

These 5000 year chinese temperature records show that the little ice age (1300-1850AD)
was not just a European event , it was also the coldest period in the last 5000 years.

View attachment 974963

How do you interpret the top graph ? is it 300 years of warming or 3000 years of cooling ?
Climate optimum, what and when was that, was it when Africa was still green, or when Viking’s were growing barley. And the point your skipping over is populations the number of mouths we have to feed if we are growing crops in the Greenland have we lost current fertile land to weather extremes? If so what effect will that have?
Ps the land near and at the poles is not a vast area stretched flat maps show it to be. If we lose an extra hundred miles north and south of the equator to desertification or temps, it’s not going to be replaced at the poles.
Your trying to put an optimistic spin on what will be a disaster for our culture lots of cultures have been lost due to weather and climate in history picking the ones that farmed Greenland as a prediction of ours is not that sensible, billions will starve before we are farming Greenland.
 

Bogweevil

Member
Scientists have published more than 350 peer-reviewed studies looking at weather extremes around the world, from heatwaves in Sweden and droughts in South Africa to flooding in Bangladesh and hurricanes in the Caribbean. The result is mounting evidence that human activity is raising the risk of some types of extreme weather, especially those linked to heat.

https://www.carbonbrief.org/mapped-how-climate-change-affects-extreme-weather-around-the-world

View attachment 974922


To track how the evidence on this fast-moving topic is stacking up, Carbon Brief has mapped – to the best of our knowledge – every extreme-weather attribution study published to date.

Carbon Brief’s analysis reveals:

– 70% of the 405 extreme weather events and trends included in the map were found to be made more likely or more severe by human-caused climate change.

– 9% of events or trends were made less likely or less severe by climate change, meaning 79% of all events experienced some human impact. The remaining 21% of events and trends showed no discernible human influence or were inconclusive.

– Of the 122 attribution studies that have looked at extreme heat around the world, 92% found that climate change made the event or trend more likely or more severe.

– For the 81 studies looking at rainfall or flooding, 58% found human activity had made the event more likely or more severe. For the 69 drought events studied, it’s 65%.
 

C.J

Member
Livestock Farmer
Location
South Devon
And now some good news ( it wasn't on the BBC)

The Great Barrier Reef has recovered.

1627217445979.png


It must have been that led bulb I bought back in 2012.
 

Bogweevil

Member
Intense rainstorms are expected to be more frequent due to global warming, because warmer air can hold more moisture. Here, using very detailed climate simulations (with a 2.2 km grid), we show that the storms producing intense rain across Europe might move slower with climate change, increasing the duration of local exposure to these extremes. Our results suggest such slow-moving storms may be 14× more frequent across land by the end of the century. Currently, almost-stationary intense rainstorms are uncommon in Europe and happen rarely over parts of the Mediterranean Sea, but in future are expected to occur across the continent, including in the north. The main reason seems to be a reduced temperature difference between the poles and tropics, which weakens upper-level winds in the autumn, when these short-duration rainfall extremes most occur. This slower storm movement acts to increase rainfall amounts accumulated locally, enhancing the risk of flash floods across Europe beyond what was previously expected.


C.J

Member
Livestock Farmer
Location
South Devon
1628328729316.png


And when you add CO2 to the graph , there is no correlation .

1628329368604.png


NASA cooled 2016 data to make 2020 the "hottest year ever" but the top graph and Banjo's graph show that both 2016 and 1998 were hotter than 2020.
 

linga

Member
Location
Ceredigion
View attachment 978330

And when you add CO2 to the graph , there is no correlation .

View attachment 978331

NASA cooled 2016 data to make 2020 the "hottest year ever" but the top graph and Banjo's graph show that both 2016 and 1998 were hotter than 2020.


Your graph( or rather your conclusion) presupposes that the extra energy trapped by rising CO2 only has an effect on air temperature.


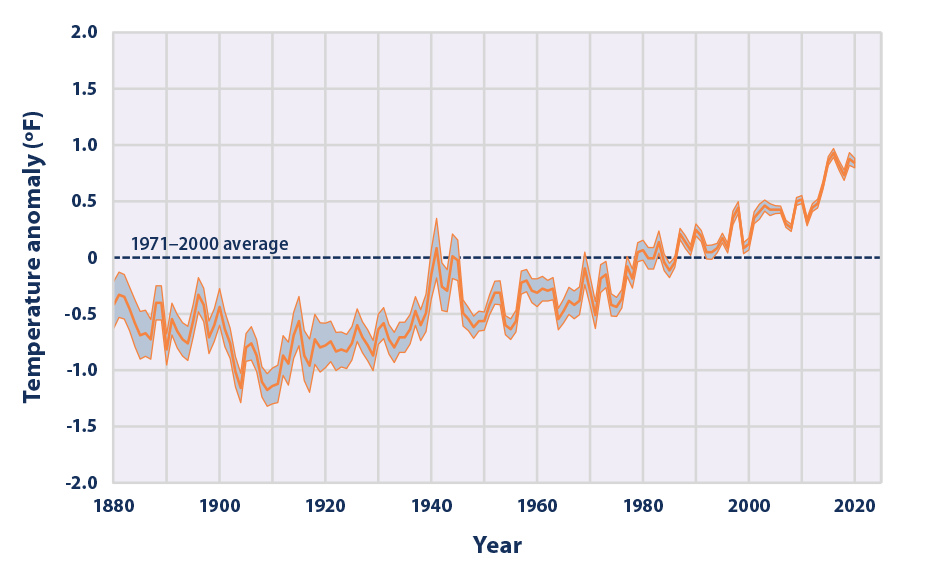
Figure 1. Average Global Sea Surface Temperature, 1880–2020
Line graph showing changes in average global sea surface temperature from 1880 to 2020.

Download Data Download Image


This graph shows how the average surface temperature of the world’s oceans has changed since 1880. This graph uses the 1971 to 2000 average as a baseline for depicting change. Choosing a different baseline period would not change the shape of the data over time. The shaded band shows the range of uncertainty in the data, based on the number of measurements collected and the precision of the methods used.
Data source: NOAA, 20217
 

C.J

Member
Livestock Farmer
Location
South Devon
Your graph( or rather your conclusion) presupposes that the extra energy trapped by rising CO2 only has an effect on air temperature.


Figure 1. Average Global Sea Surface Temperature, 1880–2020
Line graph showing changes in average global sea surface temperature from 1880 to 2020.

Download Data Download Image


This graph shows how the average surface temperature of the world’s oceans has changed since 1880. This graph uses the 1971 to 2000 average as a baseline for depicting change. Choosing a different baseline period would not change the shape of the data over time. The shaded band shows the range of uncertainty in the data, based on the number of measurements collected and the precision of the methods used.
Data source: NOAA, 20217

Your graph still has 2016 as the hottest.

It will be interesting to see an updated version of your graph because the data shows about 12 months of cooling to June 2021.
 

HatsOff

Member
Mixed Farmer
Your right the green index is rising but they were also right, how can this be, well it’s cold areas warming up going green, and dry hot areas going not green, while the balance has been towards greening, how much is just C02 how much is changing temps near the poles is the real question.
One thing is true plants will grow especially trees when we increase the amount of what they consume upwards but that’s not to say it’s all positive. Having millions of acres of perma frost start to green is not 100% likely to be a positive sign.
also the fact dispite the growing greening which would normally help balance out the planets C02 levels it still rises.

weather and climate are linked, but the results of those links are less predicable, so when polar weather moves north or south and makes new records it’s not just weather it’s climate change because mean while those poles were at higher temps than normal because weather and climate moved the normaly semi stable weather over the poles to shift.

instability in the normal weather patterns and more extremes are in the climate predictions, these are just weather, but the underlying driver seems to be the rising temps the planet as a whole is experiencing, if there was just a scientific explanation for those rising temps. . .
I have yet to see any science to explain the rising temps trend other than C02 the trillion dollar fossil fuel industry has yet to find it, not for the lack of trying, or the money to do so.

I will say, with the money and power the fossil fuel industry has, if one shred of science pointed to C02 not being the underlying factor they would be shouting about it all over the main stream media, and making sure everyone knows about it, they would get it pear reviewed and publicised. The lack of this says it all. Yet they do spend there money to quietly suppress change to laws and the push to renewable tech. Banning domestic roof top solar in some states in the USA, dragging of feet over alternatives to ICE cars, etc etc.

I don’t worry about the planet, I worry about or civilisation as we know it, I personally think we are selling or children’s children down the river, for a few pieces of silver. We all are so fixed in our way of life, that when the writing is on the wall so to speak, we just walk past it, or worse deny it.
The writing is on the wall but some people are spray painting over it in a bid to continue as normal even when they them selves know the result. Because making money is all that’s important.

I can tell you now it’s the fossil fuel industry pushing the needle to blame farming for climate change, because it take the focuse off them.
Don’t ban ICE cars until 2040 because if we ban red meat now we can have ICE cars longer. . .
I personally don’t think grass feed animals should even be considered a problem, yet somehow they are public enemy number one, in the main stream media. . . Now why is that a who is making that happen. . .

climate scientists adverted a cutting in the use of fossil fuels but that seems have been shifted in the media by someone. . . If I had to guess it’s not just the vegan lobby it’s the so called special intrests groups that are fanning those flames getting the media spotlight to point in other directions for the right amount of cash. . .

Spot on. Denialism is playing into the hands of the oil companies who are just looking to deflect blame onto farmers. I cannot buy the idea that tens of thousands of scientists have been all colluding for decades in a mass scam to make us think the world is getting warmer. Besides, you can't be an expert in everything and I can't effectively try and understand climate science and do my own job, so I do need to trust what the experts are telling us.
 

C.J

Member
Livestock Farmer
Location
South Devon
Spot on. Denialism is playing into the hands of the oil companies who are just looking to deflect blame onto farmers. I cannot buy the idea that tens of thousands of scientists have been all colluding for decades in a mass scam to make us think the world is getting warmer. Besides, you can't be an expert in everything and I can't effectively try and understand climate science and do my own job, so I do need to trust what the experts are telling us.

Of course the earth is warming - its been warming for 300 years since the Little Ice Age.

The Little Ice age was the coldest period in the last 8000 years

1628340421834.png


We should be looking at the bigger picture and be more worried about 8000 years of cooling rather than 300 years of warming.
 

linga

Member
Location
Ceredigion
Your graph still has 2016 as the hottest.

It will be interesting to see an updated version of your graph because the data shows about 12 months of cooling to June 2021.
The graph I posted was in response to your assertion that CO2 was not correlated with warming.
you posted a graph of air temperature and ignored the warming of the oceans over decades.
Some might say you were cherry picking data to support your view but that could be a bit unfair
 

C.J

Member
Livestock Farmer
Location
South Devon
The graph I posted was in response to your assertion that CO2 was not correlated with warming.
you posted a graph of air temperature and ignored the warming of the oceans over decades.
Some might say you were cherry picking data to support your view but that could be a bit unfair

The reason why I chose that graph was because it includes 2020 and some 2021 data.

Yes there is only 26 years of data but the start and the finish are both at about -0.1 centigrade

Therefore overall the warming has been negated by cooling whereas CO2 rises every year by 2 ppm
irrespective of whether air or sea is up or down.
 

linga

Member
Location
Ceredigion
The reason why I chose that graph was because it includes 2020 and some 2021 data.

Yes there is only 26 years of data but the start and the finish are both at about -0.1 centigrade

Therefore overall the warming has been negated by cooling whereas CO2 rises every year by 2 ppm
irrespective of whether air or sea is up or down.
If the sea is warming it must be absorbing energy.
you put up a graph purporting to show no correlation with CO2 and warming then ignore the oceans.
 

C.J

Member
Livestock Farmer
Location
South Devon
If the sea is warming it must be absorbing energy.
you put up a graph purporting to show no correlation with CO2 and warming then ignore the oceans.
I see your graph is from the EPA - here is another one of their graphs.

1628410540213.png


This expains why in the following picture, over half the US states(32/50 = 64%) haven't set a new maximum temperature after 1940.

1628410701567.png
 

Attachments

  • 1628410662123.png
    1628410662123.png
    91.6 KB · Views: 0

linga

Member
Location
Ceredigion
The point I am making is that you are cherry picking data, firstly by only looking at air temperatures whilst ignoring ocean temperature then looking at an extreme outlying decade in America whilst ignoring the fact that that decade was not especially warm globally.
 

Two Tone

Member
Mixed Farmer
The reason why many believe in Climate change is that the majority of Scientific opinion believes that it is occurring.
That doesn’t mean that it definitely is, or isn’t.
Prediction opinions tend to be exaggerated, especially when linked to some sort of financial gain and even more so when research funding is involved.

It’s a bit like trying to answer the age old question of “Does God exist?”
Some will say yes, just in case He and heaven really do exist!
 

Bogweevil

Member
Climate Change 2021: The Physical Science Basis

Read the report here: https://www.ipcc.ch/report/ar6/wg1/

A.1.1 Observed increases in well-mixed greenhouse gas (GHG) concentrations since around 1750 are
unequivocally caused by human activities. Since 2011 (measurements reported in AR5), concentrations have
continued to increase in the atmosphere, reaching annual averages of 410 ppm for carbon dioxide (CO2),
1866 ppb for methane (CH4), and 332 ppb for nitrous oxide (N2O) in 20196
 

SFI - What % were you taking out of production?

  • 0 %

    Votes: 102 41.6%
  • Up to 25%

    Votes: 89 36.3%
  • 25-50%

    Votes: 36 14.7%
  • 50-75%

    Votes: 5 2.0%
  • 75-100%

    Votes: 3 1.2%
  • 100% I’ve had enough of farming!

    Votes: 10 4.1%

May Event: The most profitable farm diversification strategy 2024 - Mobile Data Centres

  • 646
  • 2
With just a internet connection and a plug socket you too can join over 70 farms currently earning up to £1.27 ppkw ~ 201% ROI

Register Here: https://www.eventbrite.com/e/the-mo...2024-mobile-data-centres-tickets-871045770347

Tuesday, May 21 · 10am - 2pm GMT+1

Location: Village Hotel Bury, Rochdale Road, Bury, BL9 7BQ

The Farming Forum has teamed up with the award winning hardware manufacturer Easy Crypto Hunter and Easy Compute to bring you an educational talk about how AI and blockchain technology is helping farmers to diversify their land.

Over the past 7 years, Easy Crypto Hunter have been working with farmers, agricultural businesses, and renewable energy farms all across the UK to help turn leftover space into...
Top