The great global warming scam, worth a listen I think.

@banjo This BBc article might or might not add some credence to your claims http://www.bbc.com/news/science-environment-43691671

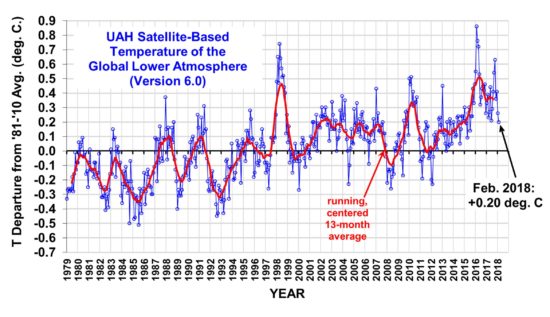
Unfortunately like many BBC "news" items - only 8 hours old as I post, it only gives information up to 2010. Why does it take 8 years to become "news"? What has happened in the intervening 8 years?

As I have posted before, it would be nice if you were right in your assumptions. Yet again, unfortunately, the consensus, according to the last few sentences in the article, appears to be that temperatures are still rising.
 

banjo

Member
Location
Back of beyond
image.png
Bit of up to date info here
 
Bit of up to date info here

......... and on top of what @linga says, you have yet again repeated a post you have already made (#1514). Can you not at least keep track of your own posts.

Additionally, as has already been pointed out to you, this is not a record of the Earth surface. As I keep telling you, we actually live on the surface of the planet not up in the atmosphere. Stick to posting once, and posting relevant information.
 

rob1

Member
Location
wiltshire
where as all of our part of europe is having a really late cool wet spring, which proves nothing, just as a hot day in Oz proves nothing, the climate is changing always has always will, the question is how much are we doing towards it, IMO we shoule err on the safe side and use as little fossil fuels etc as we can while looking at ways to be less wasteful with ALL of the worlds resources
 

banjo

Member
Location
Back of beyond
And this is the more complete graph which is,of course from the UAH which shows the lower atmosphere still warming.


UAH_LT_1979_thru_February_2018_v6-550x317.jpg
If you follow thus stuff you will notice the drop in temp since 2016 ( when this thread started ) coincides with the sea level drop during the same period and increaseed arctic ice alowing you to walk from Russia to Greenland.
The reason is its cooling.
Plus that graph is a good one but doesn't go 1930 or 1947, hotter 1930s, cooler in 1947 similar to now and that was 60 years ago due to the sun spot cycle.
 

banjo

Member
Location
Back of beyond
......... and on top of what @linga says, you have yet again repeated a post you have already made (#1514). Can you not at least keep track of your own posts.

Additionally, as has already been pointed out to you, this is not a record of the Earth surface. As I keep telling you, we actually live on the surface of the planet not up in the atmosphere. Stick to posting once, and posting relevant information.

You realy don't like another opinion do you, religious climate warming freak that ignores the fact that it sais on the chart its upper atmosphere data and I put it up originally.
You seem to like removing free speech, or stopping me put correct info up. Every chart or measurement is off NASA or noaa data from the last 3 years, dont even belive your own sides data!
Plus ignoring the weather data cos it doesnt fit your agenda, no skin off my nose cos I know it's correct and it will continue to get cooler during the next year or two.
You warming geeks have been wrong for over three years acording to your own measurements, admit it !
 

Dave645

Member
Arable Farmer
Location
N Lincs
I don’t think you can blame our disbelief, you didn’t believe us when we had 30 years of data showing warming now you expect us to roll over with only 3 years data. Which is statistically nearly irrelevant in long term trends, if the trends continue and your correct it will show in the data, but don’t expect everyone to take it as a given until they get far more data. Let’s face it, you should expect it to take no less time than it took you to believe in climate change.
201801.gif

And your right the data shows a dip, from an extreme high, but no where on the graph has seen an even regular pattern just a long term trend, because climate is complex, before you clap your self on the back to hard, let’s get that trend to dip back into blue.
 

banjo

Member
Location
Back of beyond
I don’t think you can blame our disbelief, you didn’t believe us when we had 30 years of data showing warming now you expect us to roll over with only 3 years data. Which is statistically nearly irrelevant in long term trends, if the trends continue and your correct it will show in the data, but don’t expect everyone to take it as a given until they get far more data. Let’s face it, you should expect it to take no less time than it took you to believe in climate change.
201801.gif

And your right the data shows a dip, from an extreme high, but no where on the graph has seen an even regular pattern just a long term trend, because climate is complex, before you clap your self on the back to hard, let’s get that trend to dip back into blue.

Don't try to tag me as a disbeliever in climate change, I've said all along that the climate changes, but naturally due to sun spot activity changes and different repeating periods in the Suns life cycle.
I am pointing out that pretty much everyone who's been arguing against me on this thread has been incorrect and my data was correct.
There has been a lot of false data put up by you lot trying to say it's been warming for the last three years when that is not the case, it's been cooling and sea level has been dropping and ice in the Arctic has been growing.
Co2 level is dropping aswel.
The problem you lot have is that you think your more intelligent than the rest of us and we must be a bunch of thickos cos we dont belive everything we are told, we look for ourselves and look at the measured data.
I follow this everyday, I know it off by heart and know it's getting colder, even the ocean is getting cooler at the moment.
You can't change nature, what will happen will happen as it always has before us and will after we are all gone !
 

Dave645

Member
Arable Farmer
Location
N Lincs
Don't try to tag me as a disbeliever in climate change, I've said all along that the climate changes, but naturally due to sun spot activity changes and different repeating periods in the Suns life cycle.
I am pointing out that pretty much everyone who's been arguing against me on this thread has been incorrect and my data was correct.
There has been a lot of false data put up by you lot trying to say it's been warming for the last three years when that is not the case, it's been cooling and sea level has been dropping and ice in the Arctic has been growing.
Co2 level is dropping aswel.
The problem you lot have is that you think your more intelligent than the rest of us and we must be a bunch of thickos cos we dont belive everything we are told, we look for ourselves and look at the measured data.
I follow this everyday, I know it off by heart and know it's getting colder, even the ocean is getting cooler at the moment.
You can't change nature, what will happen will happen as it always has before us and will after we are all gone !
I don’t mind what you believe, your just as entitled to your opinions as anyone, I would actually call you out for your attitude towards people who believe, in human power climate change, It’s been quite derogatory.

I have yet to see the solar cycle yet to explain the data, of what we have seen, 10 years 15 year 50 year. Please show the data source for this claim of its solar cycles.....

as for data, you do post some but it’s mostly misleading graphs or YouTube videos, I love data as long as we can see a source.
https://www.ncdc.noaa.gov/sotc/global/201801
This is my source and yours according to your last graph post you chose to share a small section from the data that backs your theory, our theory is it’s to early, to call it as climate change has stopped, its not man made no need to make changes.....

If you look at this link at data you now claim is accurate after a long argument saying our data sources are tampered with and not true, the second they back your theory your happy to except our data......
Then exempt it as a whole not just cherrying pick data, when you do it’s hard to ratify your conclusions just yet looking at the data, and that’s just being scientific not worshiping climate change..... or any of the other derogatory terms you have used in some of your posts.

As for Co2 it’s still predicted to rise over the year.
https://www.metoffice.gov.uk/research/climate/seasonal-to-decadal/long-range/forecasts/co2-forecast
If you care to read the data. Or quote your source? For your conclusion CO2 is falling. If you want a proper debate post proper data that we can all study..... not misleading small sections of graphs.
 
If you follow thus stuff you will notice the drop in temp since 2016 ( when this thread started ) coincides with the sea level drop during the same period and increaseed arctic ice alowing you to walk from Russia to Greenland.
The reason is its cooling.
Plus that graph is a good one but doesn't go 1930 or 1947, hotter 1930s, cooler in 1947 similar to now and that was 60 years ago due to the sun spot cycle.

I should not need to remind you again that you began this thread in 2017, not 2016.

This is yet another YouTuber who uses disinformation to attempt to persuade people that he is knowledgeable about climatology. This first quote is not mine, but it is an example of how thinking people are not fooled by those who claim that the planet is not becoming hotter:

Here is a MISREPRESENTATION:: At 0:15 Heller shows a cutting from the New York times, 60 years ago. What he never told you was that at that time of year Arctic sea ice is at a seasonal low, so today it averages well under a metre thick. So if the article is correct, then Arctic sea ice thickness is today HALF as thick as it was 60 years ago. Here is a LIE: At 4:15 Heller claims "even though we have good sea ice data going back to the 1920s" and he shows a chart from Vinnikov et al. (1980). He does not tell you that Vinnikov's chart is out by a margin of over 100% - which you can easily check against the data Heller presented from the DMI at 0:40. Furthermore, the document Heller quoted from states this about the data he used, "Although it is possible that the data sets are incomplete". In FACT we have exceptionally unreliable sea ice data prior to 1979.

It has been easy throughout this thread to demolish the links you post from these people. Often, as in this case, somebody else has already done the work.

If you want to be kept fully and accurately informed of arctic temperatures then bookmark this link and look at it every day instead of YouTube http://ocean.dmi.dk/arctic/meant80n.uk.php

Your man Heller uses a single weather station of Reykjavik to demonstrate what he claims to be temperatures for “the Arctic”. Reykjavik just happens to be a place with a lot warmer temperature than many other places hundreds of miles further south. Its climate is so mild (rarely dropping below -15ºC or about on a par with the Highlands of Scotland) that it is officially classified as “sub Arctic”. There is a reason for this of course – an extension of the Gulf Stream, and this could change dramatically with sea level rises. Ah yes, sea levels. Try this recent paper http://www.pnas.org/content/early/2018/02/06/1717312115

I note you are waffling on again about walking from Greenland to Russia. You know you cannot tell me the answer to the question I have asked twice – When was it not possible to (theoretically) do that in the Northern Hemisphere winter?

I do not know how many times you will need to be told this before you believe it, but the 1930s were not particularly hot. True there were some very hot days in parts of the USA, but there were also record low temperatures recorded, and some of those lows still stand. As with Australia at the present time, these record highs from a small part of the world (USA is about 3% of the planet, and smaller than Australia) have only minimal effect on global temperatures. This is what matters from an overall point of view – the global effect.

As for your 1947 low sunspots, I remind you of what I posted a few weeks ago:

#1468 P 74 2/3/18.

During 1947 sunspots were more numerous than during any other year of the past century. The mean relative sunspot number for May 1947 was 206,5, the second largest for any month since 1749, which was the first year for which monthly relative sunspot numbers have been assigned. The only larger number was 238.9, for May 1778. In December 1836 the mean number was 206.2, essentially the same as that for last May. Only two other months, January 1837 and October 1847, have had relative sunspot numbers larger than 180.

You realy don't like another opinion do you, religious climate warming freak that ignores the fact that it sais on the chart its upper atmosphere data and I put it up originally.
You seem to like removing free speech, or stopping me put correct info up. Every chart or measurement is off NASA or noaa data from the last 3 years, dont even belive your own sides data!
Plus ignoring the weather data cos it doesnt fit your agenda, no skin off my nose cos I know it's correct and it will continue to get cooler during the next year or two.
You warming geeks have been wrong for over three years acording to your own measurements, admit it !

You really do not read other people’s posts do you? You really do not know what you post yourself do you? If you did, you would understand what other posters say instead of imagining what they say, and you would not continually repeat posts you have already made.

I posted that you had posted the same thing twice. I think that is as good an acknowledgement as you will ever get that you originally posted it. It is in fact a small portion of a chart of LOWER Atmosphere temperatures, not Upper. @linga posted the full graph. He was not so unkind to you as to point out that you (and your hero who posted the chart for you to copy) had done precisely what you, your hero and all other deniers complain that others do – delete information from the original data.

Your remark “You seem to like removing free speech, or stopping me put correct info up.” is absolutely ludicrous and impossible for me to achieve. Why do you continue to post that others are trying to stop you from posting? None of us have the power to do so even if we so wished. Has anyone suggested in a post that you should stop posting? Several have suggested that you should stop relying on YouTube for your information and use original published data or data you have collected yourself – such as actual temperature records, but none of us have tried to prevent you posting. Someone who joined the thread briefly for a while did tell you that you were embarrassing yourself by the way you posted, and the material you posted.

I do believe the NASA and NOAA information. Why would I not? They show what is actually happening on a long term basis. The fact that you and your heroes choose to show only small sections of these charts, graphs etc. that suit your point of view, instead of showing the information in its entirety, seriously diminishes your credibility. Posting short term atmospheric temperatures to try to convince readers that surface temperatures are falling is just sheer stupidity – although I accept that it will convince those who do not know the difference. Again, several of us have continuously told you that we hope you are right and global warming will soon cease, but posting YouTube information from charlatans and people who do not understand will not change what is actually happening.

I do not ignore weather data. I have asked you on numerous occasions to find a single weather station that confirms your outrageous suggestion that temperatures have been falling for three years. You do not even have a simple weather station yourself otherwise you would be able to prove to us that at least on your property the temperatures are falling. Very easily done if that is in fact happening. I know that my own record shows a higher than average global increase, therefore I do not use this single record as evidence of anything other than how to use that information in my day to day farming. The recent extreme high temperatures in Australia similarly cannot be used as evidence to determine a global trend.

You do not know that global temperatures have been falling for the last three years. You cannot even produce evidence that any local temperatures have been falling for the last three years. You believe they have, and despite the fact that temperature measurements show you are wrong, I accept that you believe they have fallen. What I can say with absolute certainty is that you do not know that it will “continue to get cooler during the next year or two”. I accept that you believe it will, but you do not know.

Please show measurements to support your final sentence.


Co2 level is dropping aswel.
The problem you lot have is that you think your more intelligent than the rest of us and we must be a bunch of thickos cos we dont belive everything we are told, we look for ourselves and look at the measured data.
I follow this everyday, I know it off by heart and know it's getting colder, even the ocean is getting cooler at the moment.

So now you are back to claiming CO2 level is falling. Well as you say, facts and evidence speak for themselves. The evidence from Mauna Loa shows you are wrong. The facts are that January 2018 average was 407.98ppm; February 2018 408.35ppm; March 2018 409.46; and in the last week readings have topped 410ppm. I expect you already know that this time of year usually gives readings that are higher than later in the year, but even so the trend is still rising. ftp://aftp.cmdl.noaa.gov/products/trends/co2/co2_mm_mlo.txt is the link to the measured data!!

More unwarranted rudeness. The difference in the intelligence level of individual posters is immaterial, as is the difference in our academic achievements. We are all equal so far as having a point of view is concerned. Some may not be as eloquent as others, but I have no difficulty in comprehending what anyone posts, and I would most certainly never knock anyone for having a lesser level of education than myself. That would be foolish, because there are a huge number with a higher level. My record on TFF in fact shows that I have defended posters who have been castigated by others for not posting grammatically correctly, the misuse of words or not spelling words correctly.

On the other hand, sometimes it becomes necessary to counter those who cast aspersions. Your opinion that I am a “religious climate warming freak” is rather far from the truth. I have no religion. I do not believe in any supreme being or power. I assume your reference to me as a freak is not one that infers I have some serious physical impediment, but rather that you mean I am someone who is obsessed with Global Warming. How about this extract from your above post?

I follow this everyday, I know it off by heart

That is exremely obsessional, or, in your own words, you are a freak. I would not normally refer to you as such, I am merely using your language to make the point that name calling is not a good idea, especially when the name caller not only displays, but actively boasts of meeting the criteria for which he denigrates another. Of course name calling in a debate is always recognised as the sign of someone who is unable to support his point of view by reasoned means. You have called other posters by very rude descriptions on numerous occasions. Why? Other posters do not call you names merely because they disagree with you.

As for seas becoming cooler – try a few up to date sets of “facts and evidence”, starting with this short and very well written paper, which also includes information on the rising sea levels and is entitled “2017 was the Warmest Year on Record for the Global Ocean” https://link.springer.com/content/pdf/10.1007/s00376-018-8011-z.pdf then try this one from 13th April http://www.cbc.ca/news/canada/nova-scotia/record-high-ocean-temperatures-1.4617452 then https://www.scientificamerican.com/article/ocean-heat-waves-are-getting-worse/ and https://www.earthmagazine.org/article/disrupting-deep-ocean-warming-reaches-abyss and http://thechronicleherald.ca/novasc...eratures-rising-and-staying-high-longer-study

Without checking, I think @wilber has asked you to explain yourself or provide “facts and evidence” to support your statements even more than I have. How about doing the right thing and responding to his questions? You do yourself, and more importantly, your cause a great disservice by ignoring such requests. You cannot simply use your usual excuse that only you know the truth and post it, and resort to calling the rest of us names because we agree with the vast majority of those who are more knowledgeable on the subject and disagree with people whose only claim to fame in these matters is to post on YouTube. You know why they post on there of course – they receive money every time somebody clicks on one of their videos.
 

Dave645

Member
Arable Farmer
Location
N Lincs
i think global warming is happening, but it's not us that's doing it. It's the earths life cycle of the sun heating up the earth and the sea then creating more co2, or less when it's cooler, the delay in the sea warming or cooling is many years simple.
A hell of a lot of scientists believe the same and this realy good vid explains the whole thing in detail, cracking documentary that will open a few eyes.
Hope you watch it as its proven science not dream world stuff.
Do you still see this as true...? That the source of all the extra Co2 is the sun? I don’t think that aspect has been proven to be true.....

This was your first ever post if you have forgotten. Cosmic rays, and their 11year cycles of sun spot activity, drops down cosmic rays increase, just how is this explaining all of what we are seeing, I think it ignores, the magnifying effect of C02 that amplifies all the changes that the system of climate change are effected by, if we factor cosmic rays in due to low solar activity, then we should see increased cloud cover if it’s true which should cause lower temperatures, but when the solar activity increases if cosmic rays drop down, and so does cloud cover they may create, this allows the Co2 to do what it does increase globule temperatures. Which will show up as more extreme weather.... and temperature variations. In areas of no cloud cover the full effect of increased CO2 are in effect so we see new globule records being set....! If that doesn’t sound like an accurate description of what’s we are seeing what is....?

From what I can see the cloud cover has been masking some of the effects CO2 have on globule temperatures that some of the pollutants we also pump out are seeding these clouds that help keep temperatures stable, if CERN can prove that cosmic rays effect our cloud cover, it will help the solar effect of sunspots and cosmic rays get factored in properly, but nothing is working in isolation. By the sound of it we should be watching out for trees more as without them we would have very few clouds.... and without clouds it gets very bad very fast.

This experiment should help prove some of your theory. A clip from the linked site.

https://home.cern/about/experiments/cloud

Interesting stuff.
 
Last edited:

banjo

Member
Location
Back of beyond
image.png
Do you still see this as true...? That the source of all the extra Co2 is the sun? I don’t think that aspect has been proven to be true.....

This was your first ever post if you have forgotten. Cosmic rays, and their 11year cycles of sun spot activity, drops down cosmic rays increase, just how is this explaining all of what we are seeing, I think it ignores, the magnifying effect of C02 that amplifies all the changes that the system of climate change are effected by, if we factor cosmic rays in due to low solar activity, then we should see increased cloud cover if it’s true which should cause lower temperatures, but when the solar activity increases if cosmic rays drop down, and so does cloud cover they may create, this allows the Co2 to do what it does increase globule temperatures.

From what I can see the cloud cover has been masking some of the effects CO2 have on globule temperatures that some of the pollutants we also pump out are seeding these clouds that help keep temperatures stable, if CERN can prove that cosmic rays effect our cloud cover, it will help the solar effect of sunspots and cosmic rays get factored in properly, but nothing is working in isolation. By the sound of it we should be watching out for trees more as without them we would have very few clouds.... and without clouds it gets very bad very fast.

This experiment should help prove some of your theory. A clip from the linked site.

https://home.cern/about/experiments/cloud

Interesting stuff.

Yes I do think it's true, all the evidence shows co2 levels alter after the heating or cooling of the earth, the earths oceans heating or cooling release or take in co2 depending on the Suns heating effect ( high sun spot activity heats the oceans releasing co2 ) there is a delay when this happens and the charts show it.
Now we are in a cooling period ( low sun spot activity ) the oceans are cooling and taking back in co2 not releasing it.
Co2 is a heavy gas that find its way back to the sea from where most of it came.
The evidence shows I'm correct, co2 levels follow the earths temp not the other way around!
 

Attachments

  • image.png
    image.png
    1.1 MB · Views: 9
Last edited:

Dave645

Member
Arable Farmer
Location
N Lincs
View attachment 659558

Yes I do think it's true, all the evidence shows co2 levels alter after the heating or cooling of the earth, the earths oceans heating or cooling release or take in co2 depending on the Suns heating effect ( high sun spot activity heats the oceans releasing co2 ) there is a delay when this happens and the charts show it.
Now we are in a cooling period ( low sun spot activity ) the oceans are cooling and taking back in co2 not releasing it.
Co2 is a heavy gas that find its way back to the sea from where most of it came.
The evidence shows I'm correct, co2 levels follow the earths temp not the other way around!
You do understand that, that may only be true of natural climate change. And the fact we are seeing CO2 rising before temperatures is an indication that what we are seeing is not just natural variations due to solar, cosmic rays or any other just natural system of climate change? But actually man made changes which is the opposite of what you believe.

The evidence that Co2 follows temperature, when man was not in the picture, is actually proving that when Co2 rises in the absence of large increases in temperature that the amount of Co2 is not natural. So not made by the sun or any other natural process? You cannot argue it both ways you cannot have it as natural, and also have it as not the cause of temperature rises. Because what we are seeing now has never been seen before in the ice records! So that says not natural, so your own evidence breaks your main conclusions that’s it’s natural! If we were seeing purely natural climate change we would see Co2 levels also following natural cycles and levels.
And as far I can understand it in unbroken cloud cover higher levels of Co2 in the atmosphere create higher temperatures on the ground, so Co2 is linked to temperatures rises, it’s just we have lots of other factors also at play including your culprits the solar influence and cosmic rays. And I will add cloud cover as well.

And temperature does effect Co2 but oceans only out gas it when at saturation point and temperatures change, so this is not as big a factor as you think, as this is not the case the oceans are not at saturation point.
 

Ashtree

Member
There are experts, scientists, believers, disbelievers, conspiracy theorists, cranks, headbangers, etc, etc, all with facts, counter facts, news, fake news, agendas, etc, etc. Enough to drive anybody mad who tries to disentangle the facts from the confusion.
But the fact is from my experience on this planet (57 years), that there has been wholesale change to the weather in my part of the world. West of Ireland.
Mostly perhaps it seems to me is a lack of any kind of definition between the seasons of the year.
We have lost the hard frost associated with winter. Down from five to six weeks of consecutive days of sharp to hard frost in my young days to barely a few days now.
We rarely get proper “hay weather”, anymore! It’s become almost impossible to get “properly” saved hay with the hugely increased regularity of rain and heavy showers throughout the whole summer and harvest seasons.
The best land in the locality is quite plainly declining to a state of very poor pasture. Rushes are absolutely everywhere, encouraged by ever higher levels of rainfall right throught the year.

Call it what you want. Global warming or climate change, but it’s definitely happening, and it ain’t good!!
 

SFI - What % were you taking out of production?

  • 0 %

    Votes: 103 40.6%
  • Up to 25%

    Votes: 93 36.6%
  • 25-50%

    Votes: 39 15.4%
  • 50-75%

    Votes: 5 2.0%
  • 75-100%

    Votes: 3 1.2%
  • 100% I’ve had enough of farming!

    Votes: 11 4.3%

May Event: The most profitable farm diversification strategy 2024 - Mobile Data Centres

  • 1,320
  • 23
With just a internet connection and a plug socket you too can join over 70 farms currently earning up to £1.27 ppkw ~ 201% ROI

Register Here: https://www.eventbrite.com/e/the-mo...2024-mobile-data-centres-tickets-871045770347

Tuesday, May 21 · 10am - 2pm GMT+1

Location: Village Hotel Bury, Rochdale Road, Bury, BL9 7BQ

The Farming Forum has teamed up with the award winning hardware manufacturer Easy Compute to bring you an educational talk about how AI and blockchain technology is helping farmers to diversify their land.

Over the past 7 years, Easy Compute have been working with farmers, agricultural businesses, and renewable energy farms all across the UK to help turn leftover space into mini data centres. With...
Top