


- Location
- UK
USDA overview
https://crmagri.us12.list-manage.co...3a7f8fae8fcb7979ba&id=1801474d72&e=d4780de422
Cereals
Oilseeds
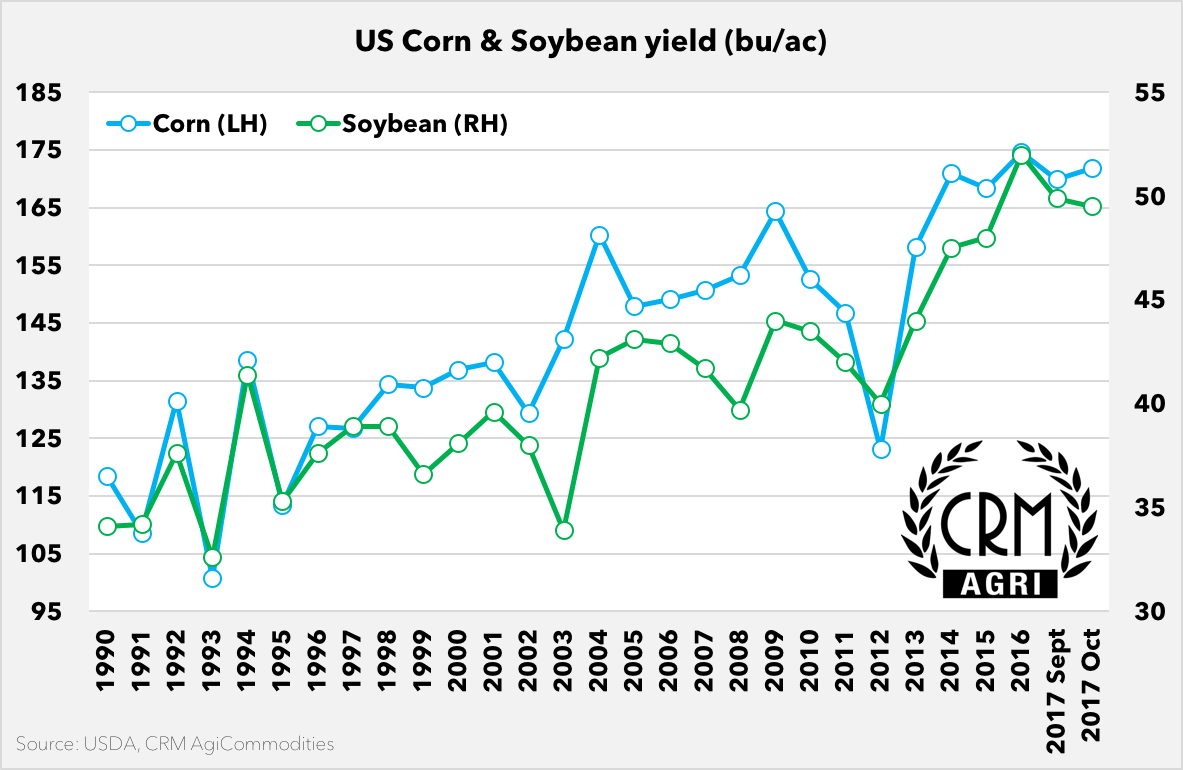
Chart of the day #2: US Corn and Soybean Harvested area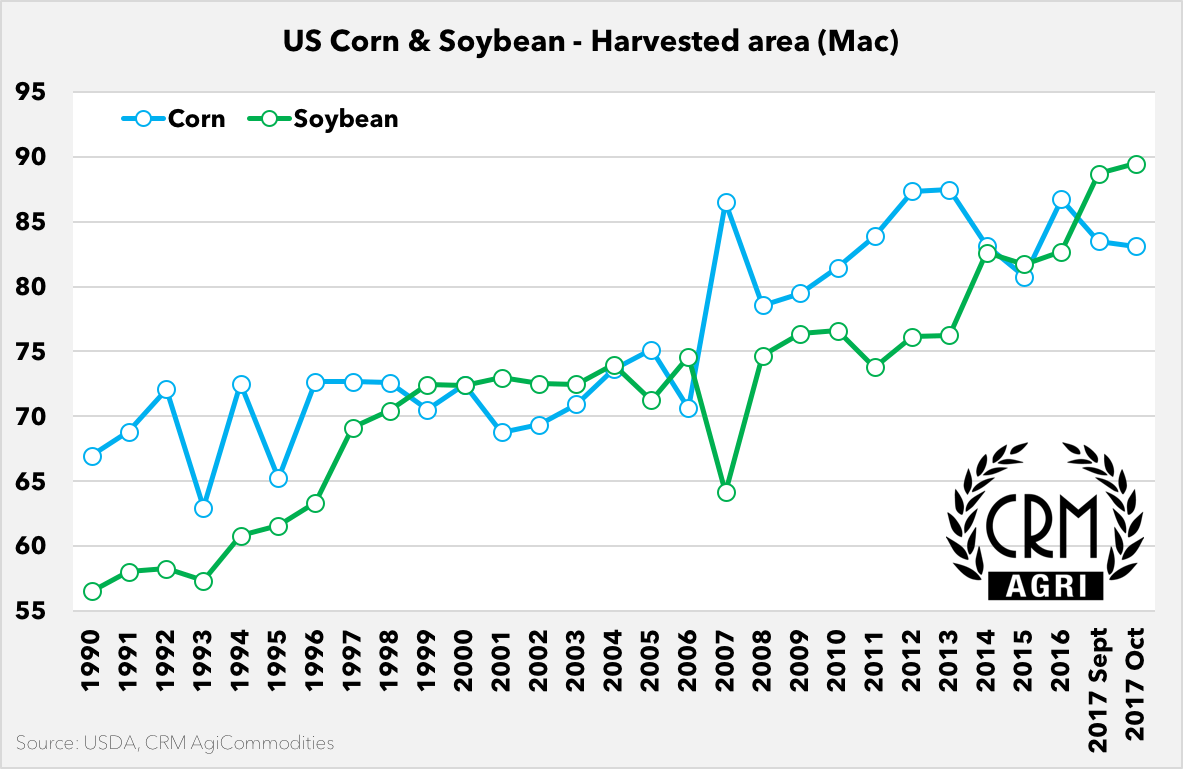
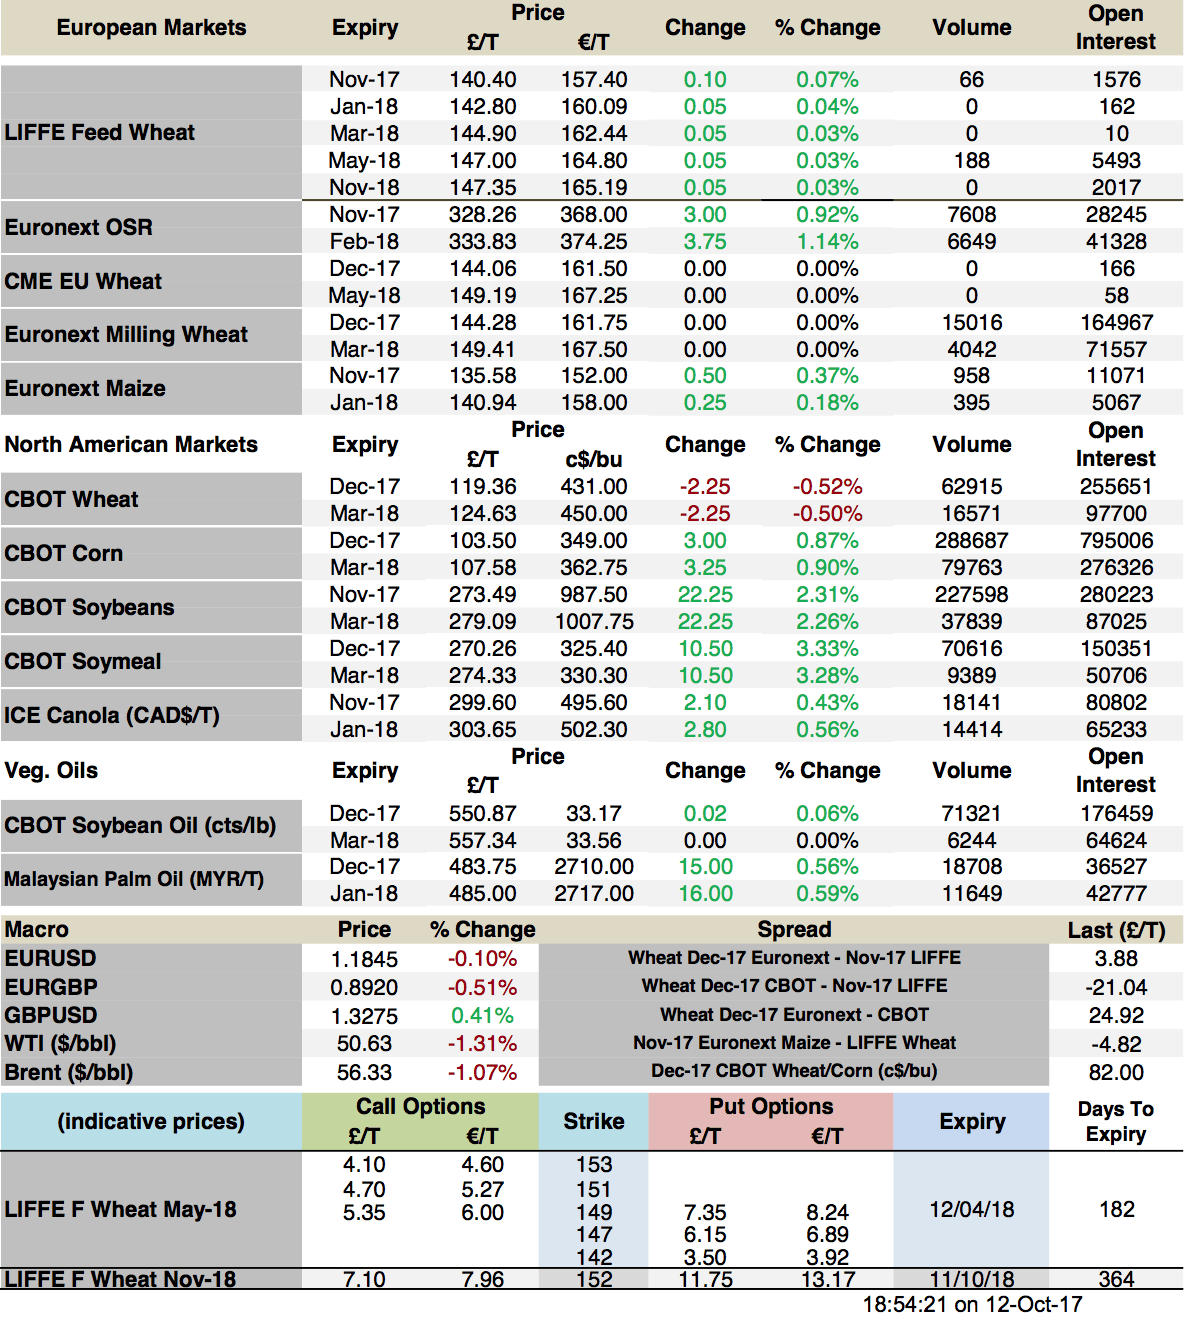
Futures & Options prices
https://crmagri.us12.list-manage.co...3a7f8fae8fcb7979ba&id=1801474d72&e=d4780de422
Cereals
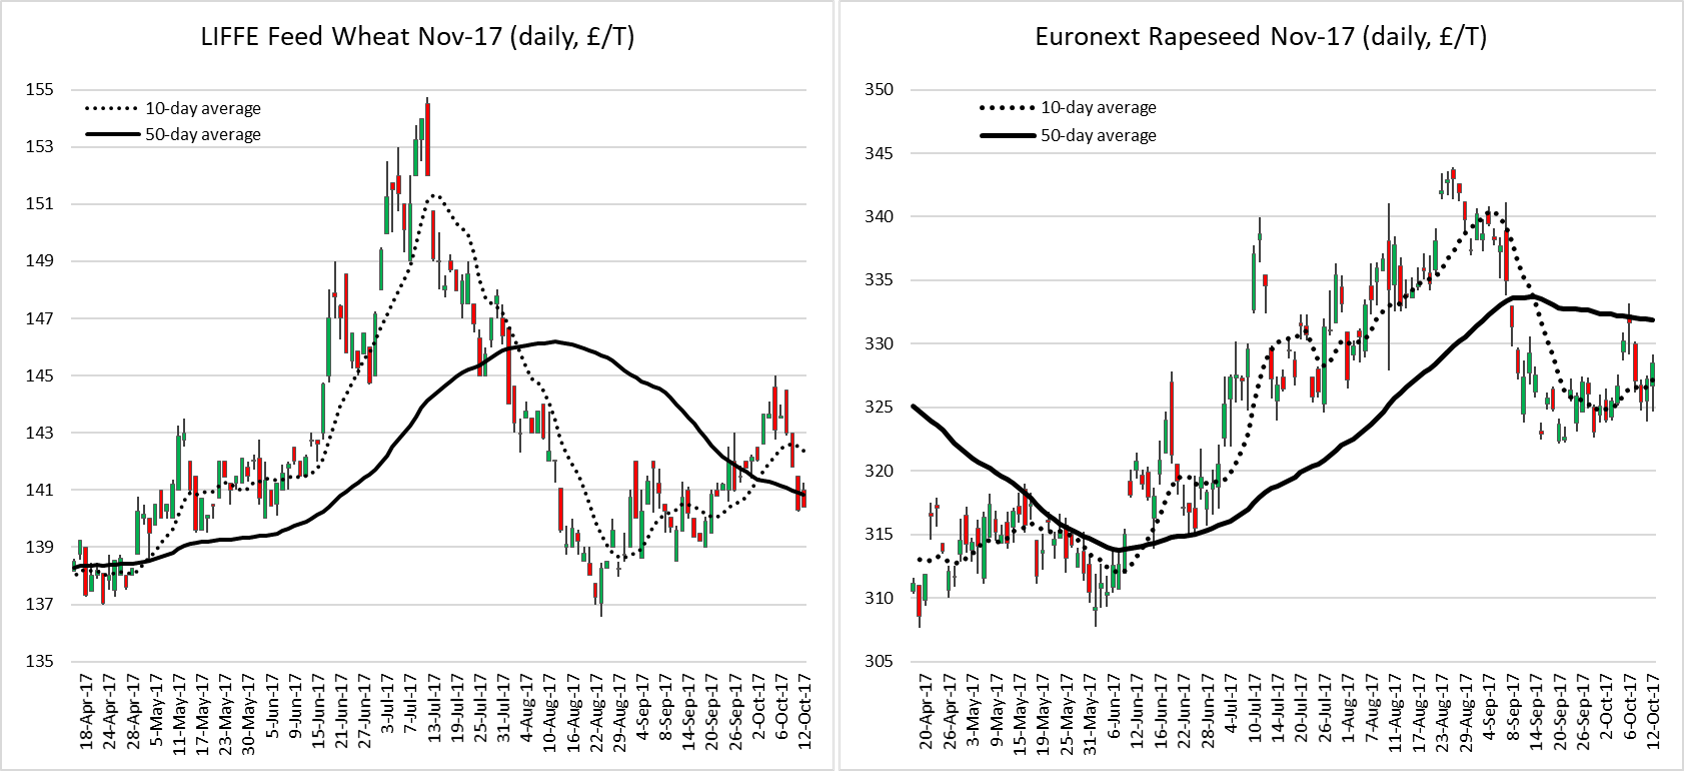
- EU grain markets were rather quiet today as expected ahead of the monthly WASDE report. Trading volumes were also thin due to the Brussels Grain exchange.
- Both UK LIFFE feed wheat & Euronext milling wheat closed near equilibrium level although the latter dropped to a fresh contract low during the day.
- EU grain exports remain extremely slow with 5MlnT of wheat exported so far this season compared to nearly 7.7MlnT last year i.e. a 35% decline.
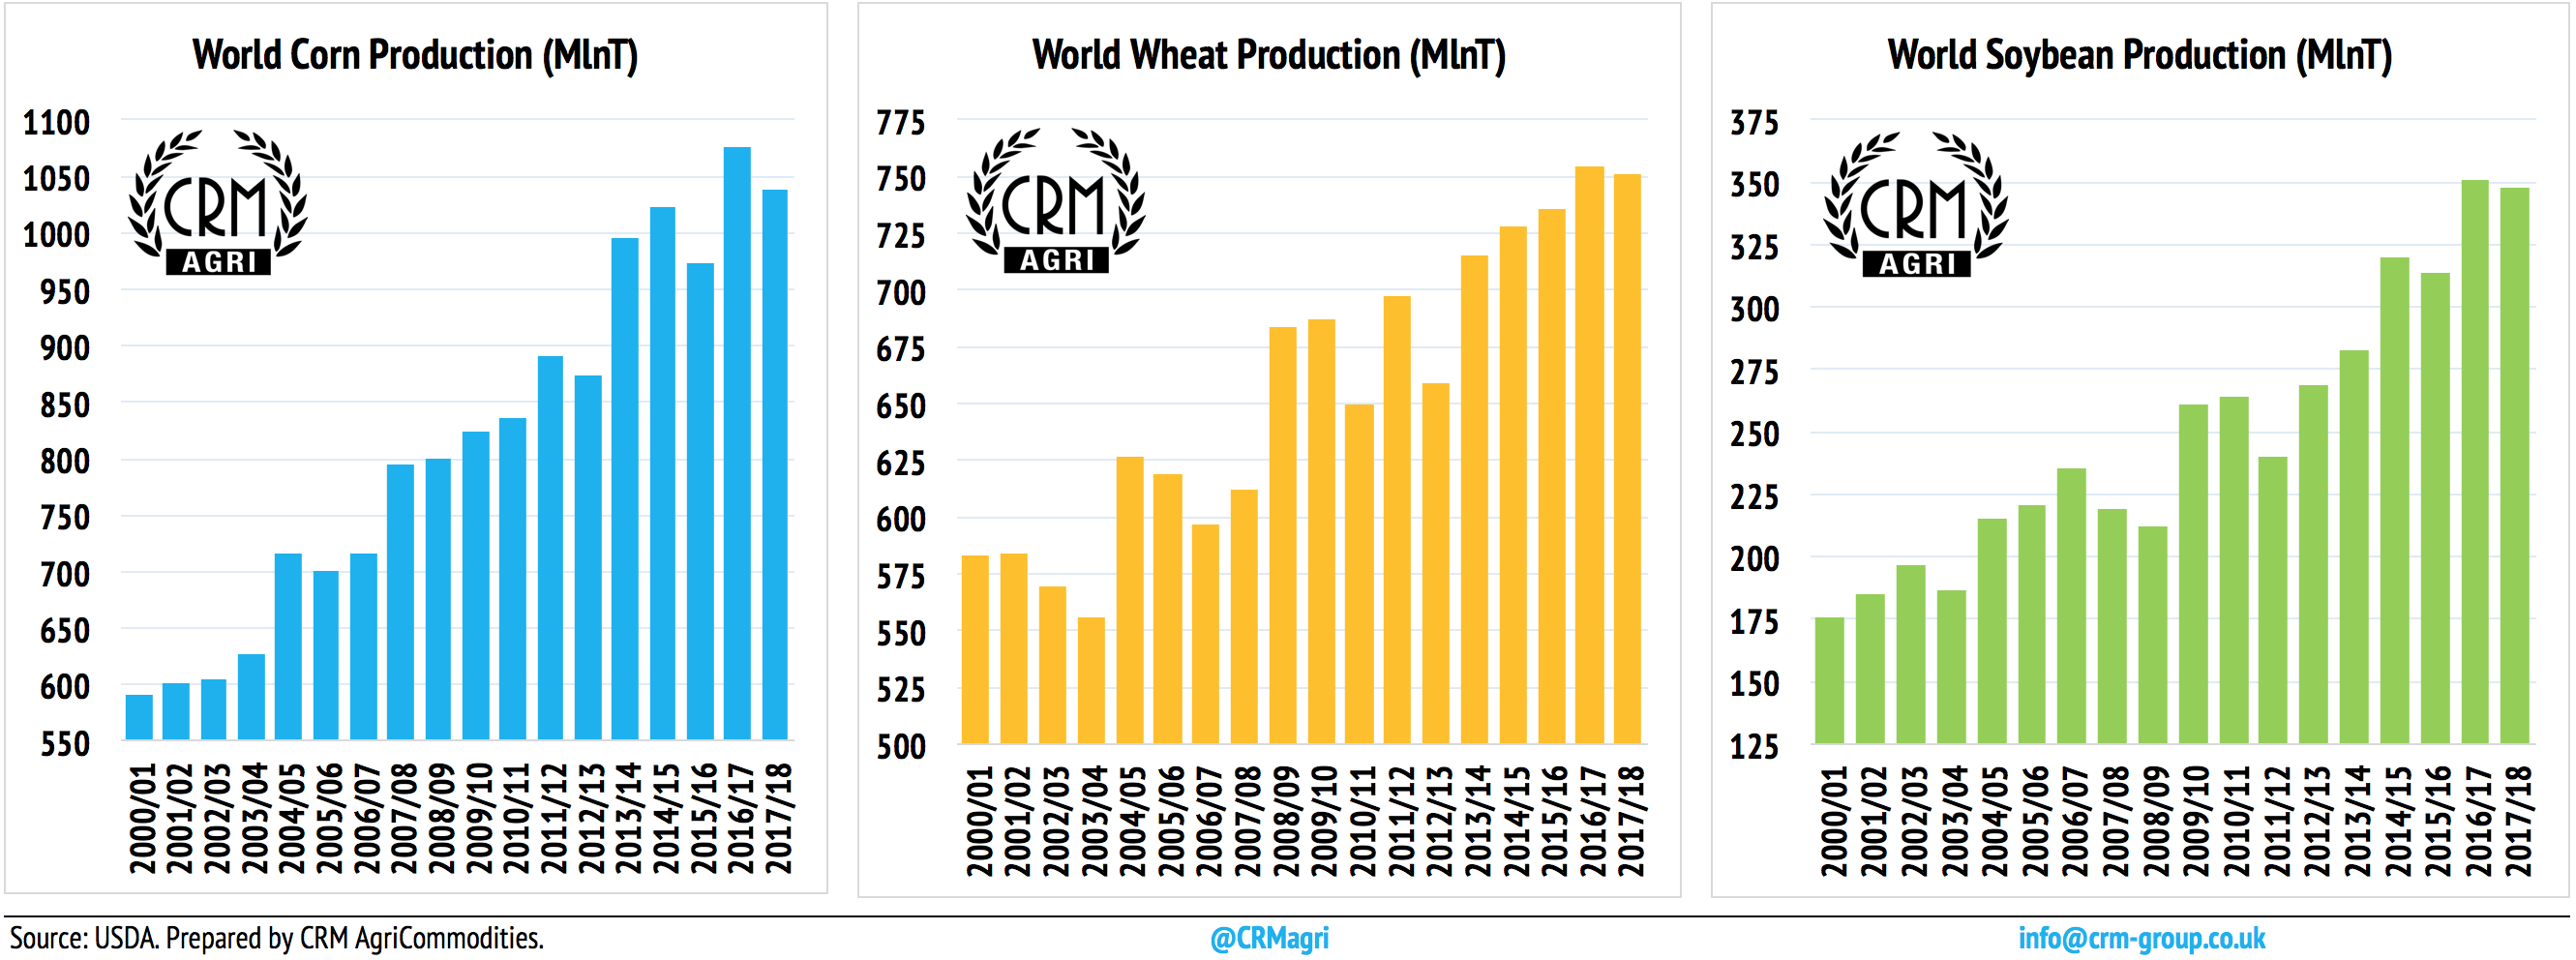
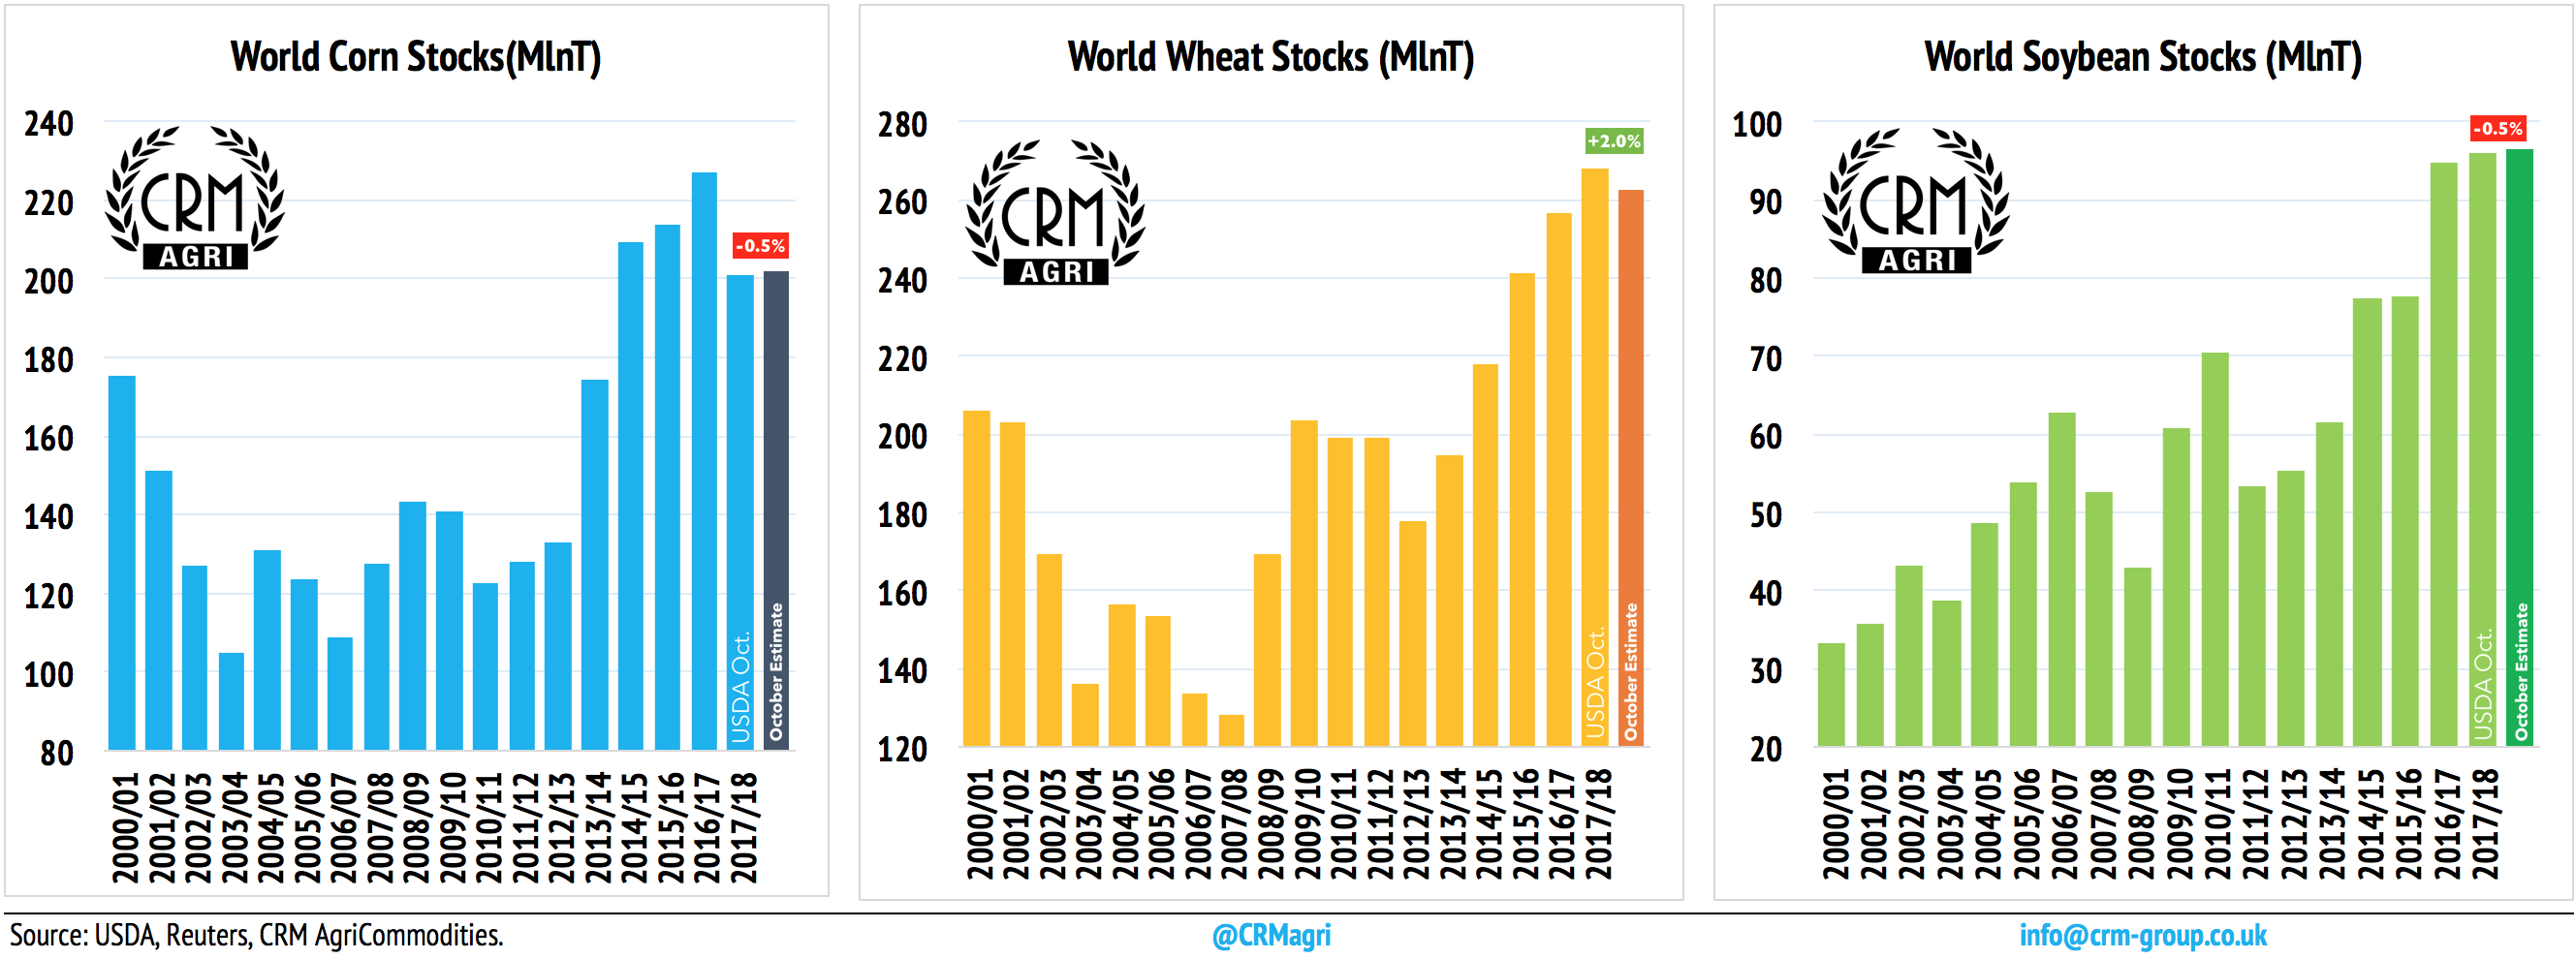
- The USDA took the market by surprise by raising its 2017/18 Global wheat production by 6.3MlnT to 751.2MlnT (vs 754.2MlnT LY) with the main increases seen in India (+2.4MlnT), Europe (+2.2MlnT) and Russia (+1MlnT) whilst the Australian crop was cut by a meagre 1MlnT to 21.5MlnT and the Argentine crop was left unchanged at 17.5MlnT. As a result, the 2017/18 global ending stocks are set to reach a new record of 268.1MlnT, more than 5MlnT above the trade forecast – the market did not react to the bearish report.
- The US corn yield was pegged at 171.8bu/ac vs 170.1 expected but the US agency reduced its harvested area forecast by 0.4Mac.
- Global production was raised by more than 6MlnT 1038.8MlnT but stocks were lowered by 1.5MlnT. The report was rather neutral for corn but followed soybeans higher.
Oilseeds
- Oilseeds were supported by the bullish US yield estimate which came in at 49.5bu/ac vs 50bu/ac expected by the market.
- Soybeans rallied following the reports and pulled OSR higher in Europe, giving the EU market some much needed bullish news to trade after a few weeks of political interference.
- Global soybean ending stock estimates for the 2017/18 season fell to 96.1MT from 96.5MT vs 97.5 last year.
- Past years present a strong case that soybean yields have further to fall in between the October and November report.
Chart of the day #2: US Corn and Soybean Harvested area
Futures & Options prices