The great global warming scam, worth a listen I think.

Pond digger

Never Forgotten
Honorary Member
Location
East Yorkshire
doney-en_34628.jpg

Here's a nice simple one.
 

Pond digger

Never Forgotten
Honorary Member
Location
East Yorkshire
Clearly there are conditions that inhibit decay- we have bog Oaks buried in the peat. What I'm saying, is that CO2 levels won't fall to such low levels while ever there is animal life on earth; plant and animal life is interdependent. However, we know there are geological and astronomical events that can throw the natural balance into chaos, and these things are completely beyond the influence of 'nature'.

Read the whole thing: don't take one sentence out of context.
 

Dave645

Member
Arable Farmer
Location
N Lincs
Over the last 800,000 years atmospheric CO2 levels have fluctuated between 170 and 300 parts per million by volume (ppmv), corresponding with conditions of glacial and interglacial periods. Prior to about 450,000 years before present time (BP) atmospheric CO2 levels were always at or below 260 ppmv and reached lowest values, approaching 170 ppmv, between 660,000 and 670,000 years ago, when the earth surface was going through various changes conditions where pretty different then now and humans were not present. the issue here is that the level of CO2 increase is not fluctuating is increasing at an alarming rate not taking thousand of years and due to various natural processes and changes to the Earth surface but taking centuries, but due to man mad activities and emissions. Co2 has gone up 40% between 1750 and 2011 to 390.5ppm.

I thank the poster that sparked the question about co2 absorption of sea water, as it seems our oceans have a large roll to play in balancing things, the cooler they are the faster they absorb co2 and other gases, they are one of the biggest carbon sinks however now they are not only collecting CO2 from natural processes, but also man made emissions of CO2, and this is the problem.

Normally It reaches a maximum saturation, at which point it stops absorbing gases, now this is the interesting bit during ice ages we have very cold seas, and water in general. This locks up vast amounts of co2 it's actual so fast at doing it that it can with the help of plant life reduce available levels of co2 in the atmosphere to as low as 170 with have been recorded in the ice records. As you say this is dangerously low for even plant life as we know it, Also bacterial life fungal and other life goes into slow mode, only pockets of life around natural hot springs and volcanic areas are still thriving, however again man was not around during those times for that reason, we had to wait untill the last few thousand years until the Earth was stable enough to permit human life.
It's not that new co2 from volcanos is not emerging during ice ages, it's that plant life and land and water absobsion are removing it too fast for it to do its job, that is until they get close to saturation point at which point it becomes more available in the air again, the normally slow processes of co2 build up has the brakes taken off with little to absorb it volcanic action and all other natural sources from natural procesess suddenly, we have massive effect, triggering the green house effect over relatively short time scales,
Which triggers temperature rises which trigger sea temperature rises which trigger co2 and other gases to be released by out gassing, by the means of the reversing of temperatures of the oceans which is accepted to lag behind land temp rises so create the co2 seeming to lag behind land and air temperatures which because sea temperatures do the out gases which bumps co2 by the greatest amounts is lagged by 200-800 years,
But that means that relatively low amounts of co2 and green house gasses can trigger an end to globe cooling and start globe warming, it's just that it's normally we only hit that when the sea has reach saturation point at the end of a natural low, and that the co2 has naturally be released at relatively slow speeds, up to that point.

We have short cutted the natural process, by releasing more co2 than the normal absorption rates the planet can deal with, so we get increasing amounts of co2 and other green house gases in the atmosphere, at an artificial point in the planets natural cycle.
This could be good, as restoring the natural rhythms, of the planet, will be aided by the planets ability to absorbed the extra co2 and greenhouse gases, if we give it chance.

So the reason we are having difficulty predicting things is we are in uncharted waters. Man made co2 is allowing for artificially high amounts of co2 into the air, which is higher than any in the last 800,000 years of history.

http://cdiac.ornl.gov/trends/co2/ice_core_co2.html
If your looking for core data.
 
Erm, it occurs to me, that since climate is in SOME way connected to the weather, or visa-versa,
AND that weather forecasting uses some of the most powerful computers in the world,
BUT still can only predict weather a few days in advance.
Chasos theory and all that, i.e. the beat of a butterflys wings in Cambodia causing hurricans in South America, etc etc.
WHY does anyone imagine they can see into our weather/our climate's future.
And make doomladen predictions.
Which they do.
And generally with added hysterics.
 
I've been studying this for ages myself, it's a hobby for me and when I see things that are wrong I say so, thats all.

If mc Donald had any idea how much I've been researching this stuff over the last few months he wouldn't say what he has, but whatever

I will join in your game of “why everyone should believe my posts rather than yours”. Whilst this post is fairly lengthy, it will take a lot less time to read than watching any of your vídeos. If you knew how much time I have spent researching “this stuff” for the past 13 years, you would not be so quick to dismiss my posts.

When I moved here in January 2003 I was sceptical that the earth was warming and that even if it was, that human CO2 and other GHG emissions were responsible. This was partly because I had accepted the statements about the vast quantity of CO2 that was emitted every time a volcano decided to burp. I now know, and I think everyone on this fórum except you also knows, that volcanic emitted CO2 is a minor amount of global emissions.

I had been a member of the Centre for Alternative Technology in Wales for quite a few years because I had been interested in the possibilities of producing my own fuel and electricity. Their quarterly magazines kept pushing this global warming idea, and I was none too happy that they were following that line instead of doing more work on alternative technologies. Over the years they became more dogmatic that it was definitely human burning of fóssil fuels, and farm livestock that were the cause of increasing temperatures and we should cull most of the livestock in the world, preferably all becoming vegetarians at the same time. I have ceased to support them.

After I had settled in I began making plans for what I would do with it agriculturally, and planned a garden and orchards for producing some of our own food. Apart from saving expenditure being ar easier to achieve than incresing income, I enjoy gardening. There were no citrus trees on the property which is unusual for the area. I began to make enquiries and discovered that the property was too cold. It is low lying compared with others around about and at slightly higher elevations such trees are common. I then began to learn about olives, almonds, chestnuts, pistáchios and the drupes such as peaches and apricots since I had a longer term plan for other trees as well as a “first project” one for a lot more olives.

I soon discovered that concerns were being raised in various countries that rising temperatures were affecting the level of winter chill which trees and other crops were receivng and some were already being affected by the lack of chill. I also found that increasing soil temperatures were causing problems for some crops. The one that struck me most was the fact that the Scottish Crop Research Institute as it then was, was finding rising soil temperature levels down to the 1 metre level. I think they did not measure below this depth. This has a bad effect on soft fruits. NZ was discovering similar problems. This led me to take the CAT information more seriously and to learn more about the subject.

I suppose you know the low chill effects such as weak, delayed and protracted anthesis, and weak leaf-out. This results in a severe reduction in yield in the cvurrent year due to poor pollination, and a likely lower yield in the following year for perennial crops due to poorer growth in the current year. I am sure most posters will be aware that there are cereal varieties that are considered to be winter ones and others that are spring ones, and that they know the reason why they are so classified.

Since I was proposing to plant tree crops that will be producing for many years, I realised that if global warming was happening I had to allow for decreasing winter chill levels in choosing the varieties to plant. If it was not happening then I had no need to worry and could plant whichever varieties were considered the most productive for the área at present. I soon discovered that global temperatures were rising. California produces 80% of the total world almond crop. Rising temperatures are so serious for them now that in the last four or five years many large scale growers have begun to spray a kaolin mix on their trees to reflect the winter Sun, thereby increasing the winter chilling effect. They are not doing this for the fun of it. It does work.

Look at my last post the global data is there for you, not your old thermometer.

My equipment for meteorological measuring is somewhat more than an “old thermometer”. Are you suggesting that my records are not accurate? That is the implication in your post. Since you claim that climate change is a hobby of yours and you have spent a lot of time over the last few months studying it, it goês without saying that you have at least a Max min thermometer, a soil thermometer and a rainfall gauge, possibly more instruments. I accept that you have only been studying the subject for a few months, but are you comparing your new data with the records of your nearest weather station over the last 20 years or so? If you are serious about the subject you will be.

I went back to college at 40 and found learning pretty easy to do and if I decide to learn something, I just get my head down and learn it.

At age 42 and having had a 15 years break from formal study I too decided to do some more studying and obtained a University Bachelor of Business degree on a part-time basis. It was 3 years for full-time students and 6 for part-timers, but I made the time to put in more hours and completed it in four. I continued to study after that and sat my last formal exam six years later. Consequently I too can “just put my head down and learn”.

Whether or not the temperature is increasing is not a hobby for me, but a necessary knowledge. I suggest it is also a necessary knowledge for all those who are intending to farm for the next few decades. My research and follow up recording hás nothing to do with models, projections, supporting scientists or what hás happened in the past. It hás all to do with the effects on my farming and gardening.

Some of the sprays I use have temperature limitations and many of the annual crops have a minimum soil temperature for germination. I need to know air and soil temperature for these reasons. Through my records I know that temperatures are continuing to rise. I planted out a lemon tree and a date palm five years ago on the strength of this increase. They both survive along with other citrus and more dates.

How do you know that the people in these vídeos you posted are experts and telling the truth? You are quick enough to lend support to them and accept their version. I am of the opinion that most of the vídeos you have put up are factually incorrect, purposely slanted to produce the figures they want, and narrated by people who are not telling the truth. That statement is no worse than what the people in the vídeos are saying about the people they are denigrating, so I have no hesitation in saying they are charlatans.

I will give you one startling example from one of your most recent vídeos – the one at #337. Look at it again from 6.45 to 7.37. It begins with the statement “warm air holds more water vapour than cold”. Then listen to what the “expert” hás to say - “yet the data shows there is less water vapour in the atmsophere. It’s been going down. Exactly the opposite of what he claims. Etc.” He backs up his nonsense by claiming that the relative humidity graph he shows indicates that humidity in the atmosphere hás fallen, and McKibben is saying the opposite of the facts. The narrator is trying to convince the audience (and obviously succeeded with you and many others) that relative humidity percentage equates to the amount of humidity in the atmosphere. No it does not. Either he is purposely blatantly lying, or he hás no knowledge of simple physics in relation to temperature and water vapour. Who is he?

Here are two very simple explanations (taken via a quick Google) of relative humidity:-

In the winter, when you heat cool air to warm your house, the air gets very dry. Why is this? There’s the same amount of moisture, but the relative humidity of the heated air is much less —the warmed air can “hold” a good deal more moisture than the cool air. Is there some special property of warm air that lets it soak up more water vapor? Not really. It’s just that, at higher temperatures, water molecules are more likely to go into the vapor phase, so there will be more water vapor in the air.

Relative Humidity : The ratio of the actual amount of water vapor in a given volume of air to the amount which could be present if the air were saturated at the same temperature. It's commonly expressed as a percentage. Since warm air will hold more moisture than cold air, the percentage of relative humidity must change with changes in air temperature.

In other words, the graph, which shows RH decreasing, is showing precisely what happens at higher temperatures. The amount of water vapour in the air is further away from saturation point (the point at which the vapour condenses to liquid water) than at a cooler temperature consequently the RH percentage is lower. It hás nothing whatsoever to do with the quantity of water vapour in the air.

I also know, as hás been known for very close to 200 years, that increasing CO2 in the atmosphere, even at its very small concentration, will affect temperatures. You may or may not choose to read this link giving a quick synopsis of the thoughts and subsequent work of19th century researchers in this field. http://history.aip.org/climate/co2.htm Nobody hás proved these people wrong. Why? Because they were and are correct.

I have been pushing you throughout this thread to produce historical temperature records to show your ongoing and constant claim about the 1930s. You have, of course, failed to do so, because the 1930s (despite the claim in some of your vídeo links) was not the warmest decade on record. In post #346 Dave645 gave a link to a large number of historical weather station records for the UK. Similar records are available for other countries. I knew from past research, but confirmed again today by checking a few of these records, that the years 1930-39 were not warmer than the years 2000-09. How do you, and your vídeo experts explain that one away?
 

Osca

Member
Location
Tayside
Well - the devil's in the detail, isn't it.

I didn't know, until this thread, about the American heatwave of 1936. Before my time, in someone else's country; yes, I'd heard of the Dustbowl and the hungry thirties, but I didn't know about the huge temperature spike of that year.

One reason I didn't know I about it is that it has been gradually smoothed out of existance on modern graphs purporting to show the true course of climate change. Yet looking into it a bit, I see that it set records which in some cases still stand; on any graph showing the annual rise and fall of temperature in the USA, this should show. That it happened is absolutely undeniable - we have the original data reported in the media of the time. I believe it is equally undeniable that the record as shown on the modern graphs - graphs that I and thousands of others have believed to be more or less true - has been falsified, and if something so big can be hidden or just left out, the given analyses cannot be trusted; end of. This isn't just sloppy science - this surely has to have been done knowingly - but if there is a watertight case for global warming why would anyone need to falsify the evidence?

That means that to get true figures one would have to start from scratch; but there is so much data; SO much data! You'd have to give up work to process it all. And what should we look at? I had a look at original meteorological records for Britain - and of course, as Old MacDonald asserts, they would probably show, if I were to sit down and do the maths, that the 1930's, with their highs and lows, were not, overall, in Britain, exceptionally hot. But this idea of a hot or cold decade is an artificial construct. Why 10 years? Why THOSE 10 years? During that time there seemed to be lots of record events - "the highest rainfall since records began" or "the warmest July for 33 years" - or "the coldest March since 1919". Of course, these extremes tend to cancel each other out.

But this is just Britain; I don't know what was happening in the rest of the world, apart from that little window on 1936 America.

I have to respect OldMacDonald's diligence in recording temperatures at his own farm; but this is of purely local interest. It might show the local weather is changing, but just like the "hot" 1930s which average out to something less remarkable, the records of a rise on one farm in Portugal might be offset by cooler conditions elsewhere or cooler times to come. Quite interesting to have that information about one's own patch of land, though.
 
Well - the devil's in the detail, isn't it.

I didn't know, until this thread, about the American heatwave of 1936

I suppose you do not know how cold it was in those same places in the same year. I suggest you find out, and then average out the annual mean.

The only reason I took a 10 year timescale was because banjo and his video links kept pushing a "decade" (meaning any x0-x9) period unless stated otherwise.
 

Osca

Member
Location
Tayside
It was probably by averaging out the heatwave against the vicious winter which preceded it that allowed it to be hidden on later graphs - despite recent summer temperatures being lower and average temperatures being - well, average.
 
14_co2_left.gif


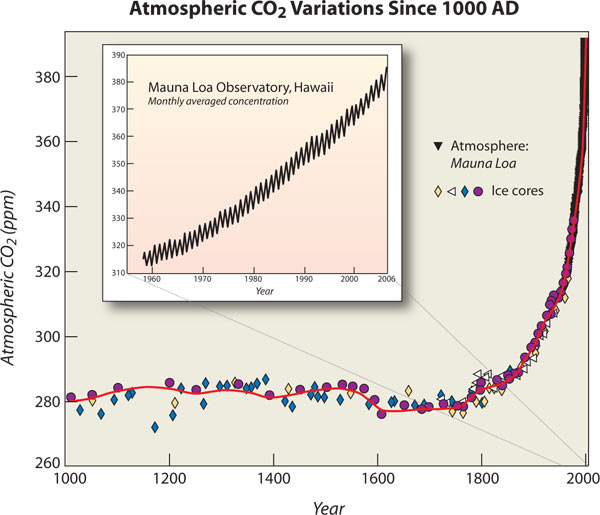
Here you go- even simpler. Its the bit above the dotted line that I'm concerned about. Clearly things have never been static, and Ive never suggested they ever were.


During the last 550 MILLION years of the Earth life CO2 in the atmosphere was over 1000 ppm for approxiamtely 450 MILLION years, with CO2 in the atmosphere being over 2000ppm for approximately 300 MILLION years and over 4000ppm for 150 MILLION years.

The other graphs you've put on also feature on the same page ... shame you declined to put this information on as well.

Phanerozoic_Carbon_Dioxide.png


And here's the text which goes with it:

Changes in carbon dioxide during the Phanerozoic (the last 542 million years). The recent period is located on the left side of the plot. This figure illustrates a range of events over the last 550 million years during which CO2 played a role in global climate.[22] The graph begins (on the right) with an era predating terrestrial plant life, during which solar output was more than 4% lower than today.[23] Land plants only became widespread after 400Ma, during the Devonian (D) period, and their diversification (along with the evolution of leaves) may have been partially driven by a decrease in CO2 concentration.[24] Toward the left side of the graph the sun gradually approaches modern levels of solar output, while vegetation spreads, removing large amounts of CO2 from the atmosphere. The last 200 million years includes periods of extreme warmth, and sea levels so high that 200 metre-deep shallow seas formed on continental land masses (for example, at 100Ma during the Cretaceous (K) Greenhouse).[25] At the far left of the graph, we see modern CO2 levels and the appearance of the climate under which human species and human civilization developed.
 
Last edited:

Pond digger

Never Forgotten
Honorary Member
Location
East Yorkshire
During the last 550 MILLION years of the Earth life CO2 in the atmosphere was over 1000 ppm for approxiamtely 450 MILLION years, with CO2 in the atmosphere being over 2000ppm for approximately 300 MILLION years and over 4000ppm for 150 MILLION years.

The other graphs you've put on also feature on the same page ... shame you declined to put this information on as well.

Phanerozoic_Carbon_Dioxide.png
There are lots of graphs and I can't show them all. I chose a couple that best illustrate the situation on a timescale most relevant to mankind. When you start going back millions, rather than thousands of years, the less confident we can be about other environmental, geological and astronomical conditions.
 
There are lots of graphs and I can't show them all. I chose a couple that best illustrate the situation on a timescale most relevant to mankind. When you start going back millions, rather than thousands of years, the less confident we can be about other environmental, geological and astronomical conditions.


I think we've all made some good points TBH.

Given todays media & politicians it pays to be suspicious and do your own research.

Thanks for the posts, I'll bow out for a while got too much to do.
 
It was probably by averaging out the heatwave against the vicious winter which preceded it that allowed it to be hidden on later graphs - despite recent summer temperatures being lower and average temperatures being - well, average.

It is not "hidden". Both figures are there in the records, but you cannot take only the summer or only the winter temperatures if you want to know what the "temperature" was for any particular time period beyond a very short one. It always begins with a daily mean, which is then, depending on what you are wanting to record, a weekly, calendar month, yearly, decade, century, etc. mean, shown on a graph or in a table.

People who want to show dishonest info would take only January 1936 or July 1936 and claim this was representative of 1936. Honest people would take the year as a whole, and show at least 1935 and 1937 alongside it. At even this relatively recent distance in time, it would be normal to take the decade as a whole. Again, though, some would take 1934 to 1943, or 1937 to 1946 as the "decade" if it suited their purpose.

Taking the many graphs displayed in a thread such as this, some people want to show recent yearly temps, others want to show historic figures over many millenia. Obviously we do not have ancient daily figures, just estimated ones, so informed guesswork goes into deciding what the tempertures may have been in past geological periods.
 
Last edited:

banjo

Member
Location
Back of beyond
Yes that is one of the other effects of volcanoes, they put vast amounts of dust and ask into the atmosphere, which reduces the amount of sunlight reaching the ground, it can have very profound effects, but that wasn't by co2 emissions.
https://ww2.kqed.org/science/2015/0...ora-eruption-what-if-this-volcano-blew-today/

But if you study these things you would realise that this effects the climate more than co2, the water vapour in the air gets dirty and causes more problems than co2 by miles as its 92% of whatever over 2% total co2 emissions.
This is pollution and I do think it has a slight efect, but our pollution will drop to bugger all when fossil fuels run out in 50 years and the western country's are doing things to combat this.
 

dstudent

Member
Thought some of you might like this regarding basic ice, water science that seems to be forgotten about these days, kids program seems logical to me.
Ok I m back really just out of frustration.
@banjo Kindly remember sea water is salty, and that makes an hell of a difference in the ammount of water displace. "It is shown that the melting of ice floating on the ocean will introduce a volume of water about 2.6 per cent greater than that of the originally displaced sea water. The melting of floating ice in a global warming will cause the ocean to rise. If all the extant sea ice and floating shelf ice melted, the global sea level would rise about 4 cm. The sliding of grounded ice into the sea, however, produces a mean water level rise in two parts; some of the rise is delayed. The first part, while the ice floats, is equal to the volume of displaced sea water. The second part, equal to 2.6 per cent of the first, is contributed as it melts. These effects result from the difference in volume of equal weights of fresh and salt water.
 

banjo

Member
Location
Back of beyond
I will join in your game of “why everyone should believe my posts rather than yours”. Whilst this post is fairly lengthy, it will take a lot less time to read than watching any of your vídeos. If you knew how much time I have spent researching “this stuff” for the past 13 years, you would not be so quick to dismiss my posts.

When I moved here in January 2003 I was sceptical that the earth was warming and that even if it was, that human CO2 and other GHG emissions were responsible. This was partly because I had accepted the statements about the vast quantity of CO2 that was emitted every time a volcano decided to burp. I now know, and I think everyone on this fórum except you also knows, that volcanic emitted CO2 is a minor amount of global emissions.

I had been a member of the Centre for Alternative Technology in Wales for quite a few years because I had been interested in the possibilities of producing my own fuel and electricity. Their quarterly magazines kept pushing this global warming idea, and I was none too happy that they were following that line instead of doing more work on alternative technologies. Over the years they became more dogmatic that it was definitely human burning of fóssil fuels, and farm livestock that were the cause of increasing temperatures and we should cull most of the livestock in the world, preferably all becoming vegetarians at the same time. I have ceased to support them.

After I had settled in I began making plans for what I would do with it agriculturally, and planned a garden and orchards for producing some of our own food. Apart from saving expenditure being ar easier to achieve than incresing income, I enjoy gardening. There were no citrus trees on the property which is unusual for the area. I began to make enquiries and discovered that the property was too cold. It is low lying compared with others around about and at slightly higher elevations such trees are common. I then began to learn about olives, almonds, chestnuts, pistáchios and the drupes such as peaches and apricots since I had a longer term plan for other trees as well as a “first project” one for a lot more olives.

I soon discovered that concerns were being raised in various countries that rising temperatures were affecting the level of winter chill which trees and other crops were receivng and some were already being affected by the lack of chill. I also found that increasing soil temperatures were causing problems for some crops. The one that struck me most was the fact that the Scottish Crop Research Institute as it then was, was finding rising soil temperature levels down to the 1 metre level. I think they did not measure below this depth. This has a bad effect on soft fruits. NZ was discovering similar problems. This led me to take the CAT information more seriously and to learn more about the subject.

I suppose you know the low chill effects such as weak, delayed and protracted anthesis, and weak leaf-out. This results in a severe reduction in yield in the cvurrent year due to poor pollination, and a likely lower yield in the following year for perennial crops due to poorer growth in the current year. I am sure most posters will be aware that there are cereal varieties that are considered to be winter ones and others that are spring ones, and that they know the reason why they are so classified.

Since I was proposing to plant tree crops that will be producing for many years, I realised that if global warming was happening I had to allow for decreasing winter chill levels in choosing the varieties to plant. If it was not happening then I had no need to worry and could plant whichever varieties were considered the most productive for the área at present. I soon discovered that global temperatures were rising. California produces 80% of the total world almond crop. Rising temperatures are so serious for them now that in the last four or five years many large scale growers have begun to spray a kaolin mix on their trees to reflect the winter Sun, thereby increasing the winter chilling effect. They are not doing this for the fun of it. It does work.


My equipment for meteorological measuring is somewhat more than an “old thermometer”. Are you suggesting that my records are not accurate? That is the implication in your post. Since you claim that climate change is a hobby of yours and you have spent a lot of time over the last few months studying it, it goês without saying that you have at least a Max min thermometer, a soil thermometer and a rainfall gauge, possibly more instruments. I accept that you have only been studying the subject for a few months, but are you comparing your new data with the records of your nearest weather station over the last 20 years or so? If you are serious about the subject you will be.


At age 42 and having had a 15 years break from formal study I too decided to do some more studying and obtained a University Bachelor of Business degree on a part-time basis. It was 3 years for full-time students and 6 for part-timers, but I made the time to put in more hours and completed it in four. I continued to study after that and sat my last formal exam six years later. Consequently I too can “just put my head down and learn”.

Whether or not the temperature is increasing is not a hobby for me, but a necessary knowledge. I suggest it is also a necessary knowledge for all those who are intending to farm for the next few decades. My research and follow up recording hás nothing to do with models, projections, supporting scientists or what hás happened in the past. It hás all to do with the effects on my farming and gardening.

Some of the sprays I use have temperature limitations and many of the annual crops have a minimum soil temperature for germination. I need to know air and soil temperature for these reasons. Through my records I know that temperatures are continuing to rise. I planted out a lemon tree and a date palm five years ago on the strength of this increase. They both survive along with other citrus and more dates.

How do you know that the people in these vídeos you posted are experts and telling the truth? You are quick enough to lend support to them and accept their version. I am of the opinion that most of the vídeos you have put up are factually incorrect, purposely slanted to produce the figures they want, and narrated by people who are not telling the truth. That statement is no worse than what the people in the vídeos are saying about the people they are denigrating, so I have no hesitation in saying they are charlatans.

I will give you one startling example from one of your most recent vídeos – the one at #337. Look at it again from 6.45 to 7.37. It begins with the statement “warm air holds more water vapour than cold”. Then listen to what the “expert” hás to say - “yet the data shows there is less water vapour in the atmsophere. It’s been going down. Exactly the opposite of what he claims. Etc.” He backs up his nonsense by claiming that the relative humidity graph he shows indicates that humidity in the atmosphere hás fallen, and McKibben is saying the opposite of the facts. The narrator is trying to convince the audience (and obviously succeeded with you and many others) that relative humidity percentage equates to the amount of humidity in the atmosphere. No it does not. Either he is purposely blatantly lying, or he hás no knowledge of simple physics in relation to temperature and water vapour. Who is he?

Here are two very simple explanations (taken via a quick Google) of relative humidity:-

In the winter, when you heat cool air to warm your house, the air gets very dry. Why is this? There’s the same amount of moisture, but the relative humidity of the heated air is much less —the warmed air can “hold” a good deal more moisture than the cool air. Is there some special property of warm air that lets it soak up more water vapor? Not really. It’s just that, at higher temperatures, water molecules are more likely to go into the vapor phase, so there will be more water vapor in the air.

Relative Humidity : The ratio of the actual amount of water vapor in a given volume of air to the amount which could be present if the air were saturated at the same temperature. It's commonly expressed as a percentage. Since warm air will hold more moisture than cold air, the percentage of relative humidity must change with changes in air temperature.

In other words, the graph, which shows RH decreasing, is showing precisely what happens at higher temperatures. The amount of water vapour in the air is further away from saturation point (the point at which the vapour condenses to liquid water) than at a cooler temperature consequently the RH percentage is lower. It hás nothing whatsoever to do with the quantity of water vapour in the air.

I also know, as hás been known for very close to 200 years, that increasing CO2 in the atmosphere, even at its very small concentration, will affect temperatures. You may or may not choose to read this link giving a quick synopsis of the thoughts and subsequent work of19th century researchers in this field. http://history.aip.org/climate/co2.htm Nobody hás proved these people wrong. Why? Because they were and are correct.

I have been pushing you throughout this thread to produce historical temperature records to show your ongoing and constant claim about the 1930s. You have, of course, failed to do so, because the 1930s (despite the claim in some of your vídeo links) was not the warmest decade on record. In post #346 Dave645 gave a link to a large number of historical weather station records for the UK. Similar records are available for other countries. I knew from past research, but confirmed again today by checking a few of these records, that the years 1930-39 were not warmer than the years 2000-09. How do you, and your vídeo experts explain that one away?

Right you seem to be getting personal for some reason, I've read your post, you were working for the green lobby ( it paid your bills and the huge grants the place got ) you went back to learn, fair play to you and I applaud you for that, but the rest is a lie and misinformation. you lot should be ashamed of yourselfs for frightening people with non science.
The people who your running down in these vids are teaching the teachers, professors, to call them fake is pretty low, these people feel their science field has been taken over by non science dogma spouting nutters who get paid for doing it, Christ even the founder of green peace thinks it's bulls**t and you must pray to him nightly.
If your crops are not growing you should be shouting for co2 cos the earths temp has changed barely a degree in any way.
Your type stop debate by trying to deemeen and dismiss evidence and they have done over the last 20 years. I notice the only ones altering charts are the green lobby, the only ones dismissing their own evidence ( sat data ) cos it doesn't match their modelled data, ( cos it's wrong and has been proved to be wrong every time) tree ring data deleated with e mails to prove it, medieval warming period moved down to make our warming trend look better ( also trying to disguise the 60 year cycle ) the next 60 year cycle will prove your wrong because people are now keeping a close eye on the charts for deception and they didn't before 1987 ( no one thought so called scientists would alter the data, but they did and that's a fact ) your like Brian cox brainwashed by incorrect data.
Here's a little lesson for you about sea ice and your 20 feet rise in sea level and plants, kids stuff for you.
 

banjo

Member
Location
Back of beyond
Ok I m back really just out of frustration.
@banjo Kindly remember sea water is salty, and that makes an hell of a difference in the ammount of water displace. "It is shown that the melting of ice floating on the ocean will introduce a volume of water about 2.6 per cent greater than that of the originally displaced sea water. The melting of floating ice in a global warming will cause the ocean to rise. If all the extant sea ice and floating shelf ice melted, the global sea level would rise about 4 cm. The sliding of grounded ice into the sea, however, produces a mean water level rise in two parts; some of the rise is delayed. The first part, while the ice floats, is equal to the volume of displaced sea water. The second part, equal to 2.6 per cent of the first, is contributed as it melts. These effects result from the difference in volume of equal weights of fresh and salt water.

Your lot sais if the sea ice melts 20ft rise in water, not including land ice, don't change the peramiters and the amount of heat needed to melt all the sea ice is going a bit nuts now isn't it, we have only heated by a degree either way in the last 100 years after all.
 

dstudent

Member
Your lot sais if the sea ice melts 20ft rise in water, not including land ice, don't change the peramiters and the amount of heat needed to melt all the sea ice is going a bit nuts now isn't it, we have only heated by a degree either way in the last 100 years after all.

@banjo is sea water a mix of salty and 'fresh' water or not?
Your video is irrelevant being tap water only, and completly different conditions,basic science there.
"New ice is usually very salty because it contains concentrated droplets called brine that are trapped in pockets between the ice crystals, and so it would not make good drinking water. As ice ages, the brine eventually drains through the ice, and by the time it becomes multiyear ice, nearly all of the brine is gone. Most multiyear ice is fresh enough that someone could drink its melted water. In fact, multiyear ice often supplies the fresh water needed for polar expeditions" In contrast to fresh water, the salt in ocean water causes the density of the water to increase as it nears the freezing point, and very cold ocean water tends to sink. As a result, sea ice forms slowly, compared to freshwater ice, because salt water sinks away from the cold surface before it cools enough to freeze."
This is why u should not take ur info solely from Youtube and should do a basic check on your sources.
Please find me any study or report who projected 20ft of water. On second thought don t bother.
Lastly the initial study that i put in my first post stated clearly sea water. So I don t know where u get land water from.
My goal was to demonstrate that the video although correct, it would only be valid if sea water was made of fresh water, but it isnt so your video is irrelevant.
Basic water science :facepalm:
Bye bye I m out.
 
Last edited:

banjo

Member
Location
Back of beyond
From what I understand the constant sea level rise is from ice flow ( land ice ) and that's why it's a constant 6 inches over a long time, cos the earth hasn't heated up more than a degree either way.
Do you need the study, just go by all gores film for the 20 ft rise frightening everyone in the process.
 

SFI - What % were you taking out of production?

  • 0 %

    Votes: 105 40.2%
  • Up to 25%

    Votes: 96 36.8%
  • 25-50%

    Votes: 39 14.9%
  • 50-75%

    Votes: 5 1.9%
  • 75-100%

    Votes: 3 1.1%
  • 100% I’ve had enough of farming!

    Votes: 13 5.0%

May Event: The most profitable farm diversification strategy 2024 - Mobile Data Centres

  • 1,836
  • 32
With just a internet connection and a plug socket you too can join over 70 farms currently earning up to £1.27 ppkw ~ 201% ROI

Register Here: https://www.eventbrite.com/e/the-mo...2024-mobile-data-centres-tickets-871045770347

Tuesday, May 21 · 10am - 2pm GMT+1

Location: Village Hotel Bury, Rochdale Road, Bury, BL9 7BQ

The Farming Forum has teamed up with the award winning hardware manufacturer Easy Compute to bring you an educational talk about how AI and blockchain technology is helping farmers to diversify their land.

Over the past 7 years, Easy Compute have been working with farmers, agricultural businesses, and renewable energy farms all across the UK to help turn leftover space into mini data centres. With...
Top