


- Location
- Stoneleigh
For much of the recent fall in prices, the potential for some more volatility on 30 June has been a key point to watch. In that regard, yesterday did not disappoint.
With the publication of US stocks figures and US acreage statistics by the USDA, Chicago maize futures (Dec-21) went “limit up”, undoing the previous twelve days of trading. Both maize acres and maize stocks came in below average trade estimates in a pre-report Refinitiv poll.
With balance of supply and demand for all grains tight coming out of the old season (2020/21) and into the new season (2021/22), any data highlighting the potential for the market to be tighter than expected is going to drive increased volatility.
What does the acreage report mean for US maize supply?
Looking at the acreage report first, the planted area for maize is estimated at 37.5Mha, with 34.2Mha expected to be harvested. The acreage estimate represents a 2.1% increase in planted area, and 2.5% increase in harvested area, year-on-year.
Applying the trend yield from the USDA June supply and demand estimates to the forecast harvested acreage suggest a crop of 385.3Mt. This is 4.5Mt greater than the USDA’s June forecast. While this would seem to be a bearish factor for markets, we need to consider a couple of key factors.
Industry expectations
As mentioned above, the figures for maize and soyabean planted area and stocks came in below the average of industry expectations. The reduced area estimates, relative to trade expectations, tightens the balance sheet of those trading the market, and so dictating the price.
Yields
This is a key factor, and one that will not be determined for some time. The current yield used in the USDA report is a record 11.3 t/ha, the five-year average yield for the US maize crop is 10.9 t/ha. If we are to see a record the crop will need excellent conditions as we move through silking (July).
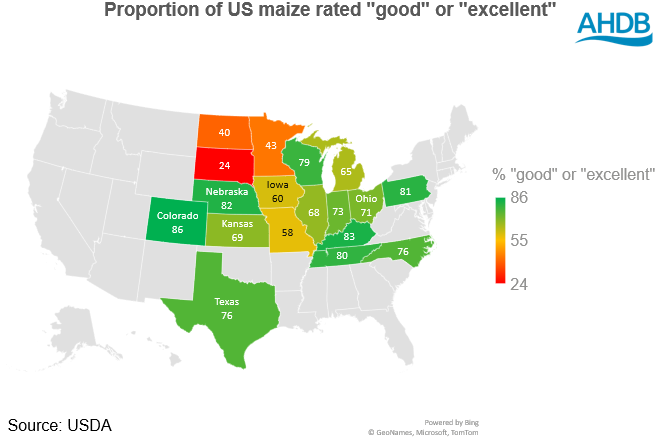
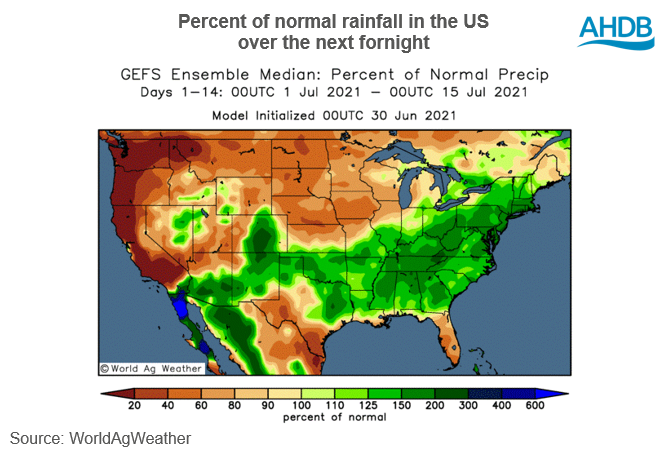
Crop conditions will continue to be watched closely over the course of the next month. While conditions in many states are positive, some of the northern states, namely North Dakota, South Dakota and Minnesota remain a concern. For now, the current weather pattern in the US looks set to stay. Conditions remain positive for the Midwest but are a concern in the more northern states.
Click here to see US maize acreage by State
What happens next?
If the bulls are to continue their run, they will need feeding.
Now the acreage data is known it will quickly be priced in, forecasts over the coming weeks, and crop conditions next Tuesday will be the next signal for prices. Beyond that, the next point of key production data will be the crop production estimates due on 12 August.
Bulls charge on acreage and stocks report
Join the 3.6K people who subscribe to our Grain Market Daily publication here - https://ahdb.org.uk/keeping-in-touch
With the publication of US stocks figures and US acreage statistics by the USDA, Chicago maize futures (Dec-21) went “limit up”, undoing the previous twelve days of trading. Both maize acres and maize stocks came in below average trade estimates in a pre-report Refinitiv poll.
With balance of supply and demand for all grains tight coming out of the old season (2020/21) and into the new season (2021/22), any data highlighting the potential for the market to be tighter than expected is going to drive increased volatility.
What does the acreage report mean for US maize supply?
Looking at the acreage report first, the planted area for maize is estimated at 37.5Mha, with 34.2Mha expected to be harvested. The acreage estimate represents a 2.1% increase in planted area, and 2.5% increase in harvested area, year-on-year.
Applying the trend yield from the USDA June supply and demand estimates to the forecast harvested acreage suggest a crop of 385.3Mt. This is 4.5Mt greater than the USDA’s June forecast. While this would seem to be a bearish factor for markets, we need to consider a couple of key factors.
Industry expectations
As mentioned above, the figures for maize and soyabean planted area and stocks came in below the average of industry expectations. The reduced area estimates, relative to trade expectations, tightens the balance sheet of those trading the market, and so dictating the price.
Yields
This is a key factor, and one that will not be determined for some time. The current yield used in the USDA report is a record 11.3 t/ha, the five-year average yield for the US maize crop is 10.9 t/ha. If we are to see a record the crop will need excellent conditions as we move through silking (July).
Crop conditions will continue to be watched closely over the course of the next month. While conditions in many states are positive, some of the northern states, namely North Dakota, South Dakota and Minnesota remain a concern. For now, the current weather pattern in the US looks set to stay. Conditions remain positive for the Midwest but are a concern in the more northern states.
Click here to see US maize acreage by State
What happens next?
If the bulls are to continue their run, they will need feeding.
Now the acreage data is known it will quickly be priced in, forecasts over the coming weeks, and crop conditions next Tuesday will be the next signal for prices. Beyond that, the next point of key production data will be the crop production estimates due on 12 August.
Bulls charge on acreage and stocks report
Join the 3.6K people who subscribe to our Grain Market Daily publication here - https://ahdb.org.uk/keeping-in-touch