


- Location
- Stoneleigh
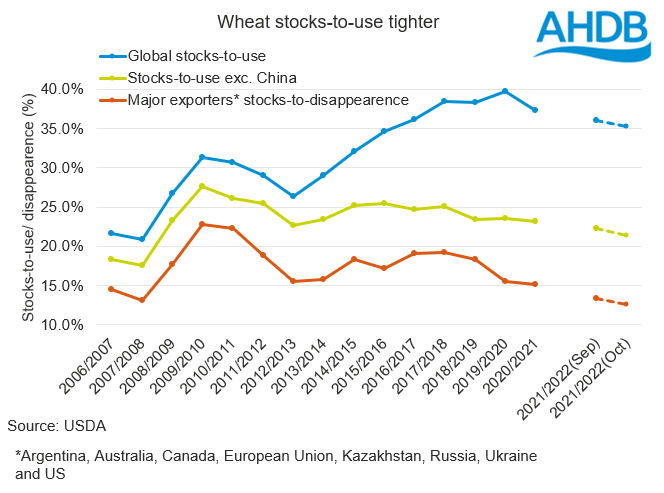
Yesterday, the USDA released, amongst other reports, its latest global supply and demand estimates. The report tightened the outlook further for wheat, taking the stocks-to-use of the crop to 35.2%, [1]still the tightest point since 2015/16. Excluding China, stocks-to-use is at the tightest point since 2007/08.
The stocks-to-disappearance (ending stocks divided by exports and consumption) of major exporters is also tightened in the latest WASDE. Moving to the lowest point since the USDA first published EU data collectively (1999/2000) at 12.6%. Stocks were revised lower for all nations except Ukraine and Canada. This tightness offers support to wheat markets.
The increased tightness stems from reduced global wheat stocks, 6Mt lower than in the September report at 277Mt. Global opening stocks are also revised lower, as is wheat production. Production cuts are seen for the US (-1.4Mt) and Canada (-2Mt). Production was revised lower; and subsequently imports revised higher, for a group of Middle East nations.
While not dramatically improved, improvements in opening stocks and production were seen in the US. Increased opening stocks were also seen in China. The combined impact of production and opening stock increases while demand is kept stable, is to increase ending stocks. This pressured maize markets yesterday.
For more on the potential impact of this be sure to watch yesterday’s Grain Market Outlook conference where we covered the possible impacts La Niña in more detail.
[1] Please note, the stocks-to-use calculation references the global wheat consumption data in the PDF version of the USDA World Agricultural Supply and Demand Estimates. AHDB note that the 2021/22 wheat consumption figure differs from the data available in USDA Production, Supply and Distribution database, which includes the latest WASDE numbers.
WASDE tightens wheat
For information on price direction make sure to subscribe to Grain Market Daily’s and Market Report from our team.
The stocks-to-disappearance (ending stocks divided by exports and consumption) of major exporters is also tightened in the latest WASDE. Moving to the lowest point since the USDA first published EU data collectively (1999/2000) at 12.6%. Stocks were revised lower for all nations except Ukraine and Canada. This tightness offers support to wheat markets.
The increased tightness stems from reduced global wheat stocks, 6Mt lower than in the September report at 277Mt. Global opening stocks are also revised lower, as is wheat production. Production cuts are seen for the US (-1.4Mt) and Canada (-2Mt). Production was revised lower; and subsequently imports revised higher, for a group of Middle East nations.
Maize stocks increased
While wheat is tighter, some of the support from the bullish changes is tempered by a more positive maize outlook.While not dramatically improved, improvements in opening stocks and production were seen in the US. Increased opening stocks were also seen in China. The combined impact of production and opening stock increases while demand is kept stable, is to increase ending stocks. This pressured maize markets yesterday.
Soyabeans down
Soyabeans followed a similar trend to maize. Ending stocks are seen growing considerably (+5.68Mt) on improved production in the US (better yields) and bigger opening stocks in the US and China. This has added further pressure to the soyabean market and aided the two-day decline in Paris rapeseed futures.What happens from here?
A key, if unsurprising, point of note is that the outlook for South America is largely unchanged. Dry weather concerns following the lingering effects of last year’s La Niña and this year’s La Niña watch could impact output of wheat in Argentina and maize and soyabeans in both Argentina and Brazil.For more on the potential impact of this be sure to watch yesterday’s Grain Market Outlook conference where we covered the possible impacts La Niña in more detail.
[1] Please note, the stocks-to-use calculation references the global wheat consumption data in the PDF version of the USDA World Agricultural Supply and Demand Estimates. AHDB note that the 2021/22 wheat consumption figure differs from the data available in USDA Production, Supply and Distribution database, which includes the latest WASDE numbers.
WASDE tightens wheat
For information on price direction make sure to subscribe to Grain Market Daily’s and Market Report from our team.